
Fig. 1.
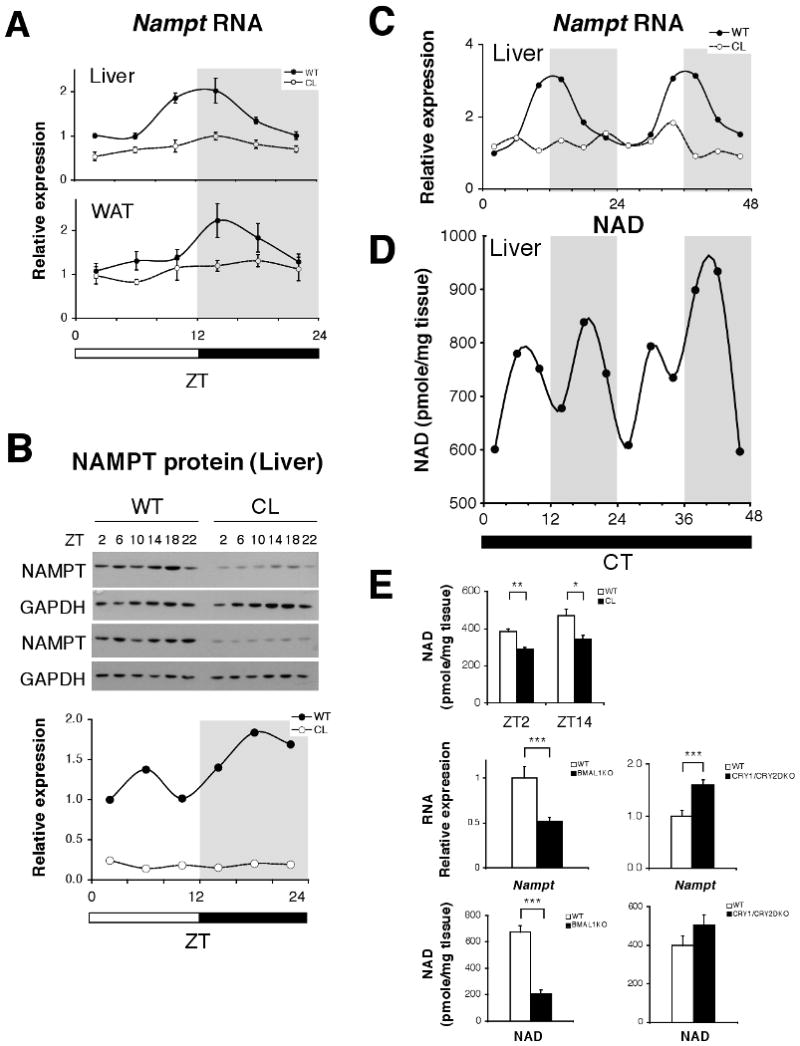
Oscillation of NAMPT-mediated NAD+ biosynthesis. (A) Relative expression levels of Nampt RNA in liver and white adipose tissue (WAT) across the 24 hr light:dark cycle. Gray shading indicates dark period (n=4-6 mice/genotype/time point). (B) Western blots showing NAMPT and GAPDH at indicated ZTs. Quantitation of NAMPT normalized to GAPDH. (C) Relative expression levels of Nampt RNA across 48 hrs in liver of WT and ClockΔ19 mice in constant darkness. Shading indicates where light and dark periods would normally occur under 12:12 LD conditions. (n=2 WT, n=1 ClockΔ19/time point); (p<0.01, one-way ANOVA for WT oscillation). (D) NAD+ levels across 48 hrs in liver of WT mice in constant darkness. (n=2 WT/time point). (E) NAD+ levels in WT and ClockΔ19 mutant liver at ZT2 and 14 (n=3) (upper panel). Relative expression levels of Nampt RNA (middle panels) and NAD+ (lower panels) in Bmal1-/-, Cry1-/-/Cry2-/-, and WT liver at ZT7 (n=4-13). *p<0.05; **p<0.01; ***p<0.001. All data is presented as mean ± SEM.