
Fig. 3.
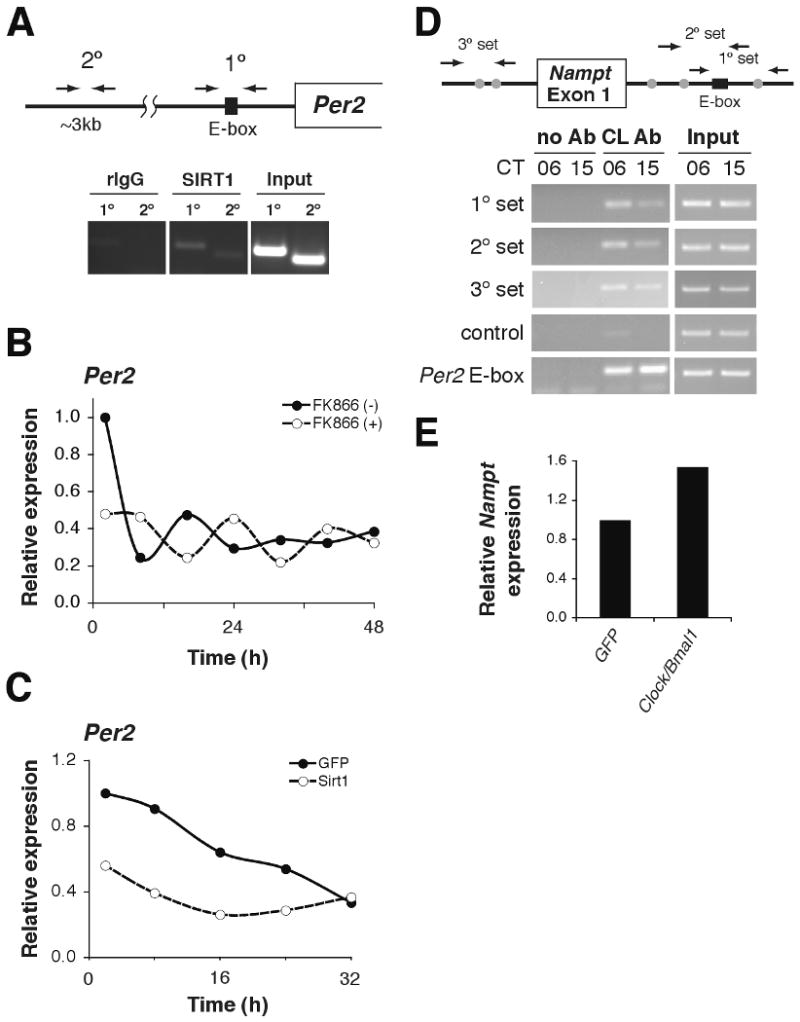
NAMPT/NAD+-driven feedback loop through SIRT1/CLOCK:BMAL1. (A) ChIP assays in primary hepatocytes for Per2 with rIgG control (left), SIRT1 antibody (middle), and input (right). Primer locations are schematically shown above. (B-C) Relative expression levels of Per2 RNA in primary hepatocytes following serum shock. Hepatocytes were either (B) incubated with 200nM FK866 or (C) infected with SIRT1- and GFP (control)-expressing adenovirus (average of 2 independent experiments). (D) ChIP assays in liver isolated from mice at CT6 and CT15 for Nampt with no Ab control (left), CLOCK antibody (middle), and input (right). Primer locations are shown schematically above. The black box indicates a canonical E-box, while gray circles represent non-canonical E-boxes. Control primers are located ∼5kb upstream of the Nampt transcriptional start site. Per2 E-box primers are included as a positive control. (E) Relative Nampt expression levels in adenovirally GFP- and Clock/Bmal1-infected mouse embryonic fibroblasts (average of 2 independent experiments).