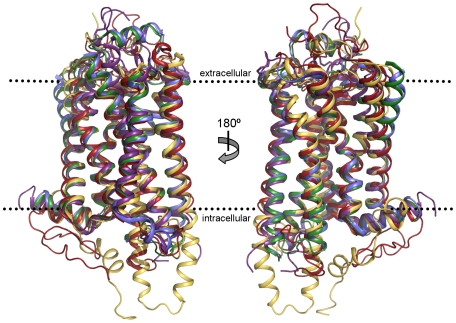
Figure 1. Structural superimposition of the five GPCR structures used in the analysis.
The overall topology of the templates are remarkably similar, with the transmembrane helices superimposing relatively well in most cases (although there appears to be more variation at the extracellular side of membrane surface). hAA2AR is represented in purple, tB1AR in blue, hB2AR in green, sRho in yellow and bRho in red. All structure images were produced using Pymol [75].

