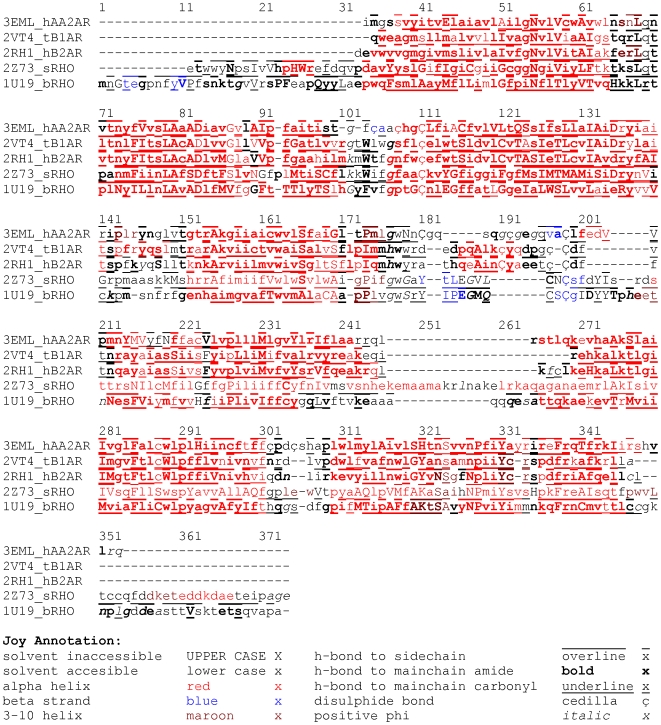
Figure 2. The structure-based sequence alignment of the five template GPCRs.
The sequences correspond to the structures in the PDB files. The local structural environment of each residue (derived from the crystal structures) is displayed using JOY annotation [76]. The helical regions (shown in red) tend to be less variable than the loop regions (shown in black).

