
Figure 1.
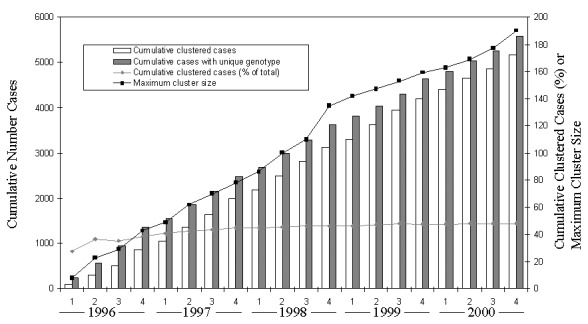
Numbers of tuberculosis cases, cumulative proportion of cases with isolates in genetic clusters, and maximum genetic cluster size from seven sentinel surveillance sites by quarter that verified case was counted, 1996–2000. Numbers of cases with isolates that had unique genotypes and those with isolates that were in genetic clusters are shown separately.