
Figure 2.
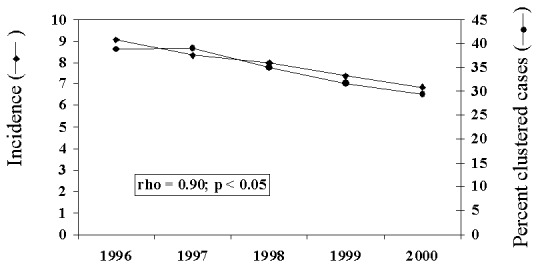
Average annual incidence of tuberculosis for seven sentinel surveillance sites and percentage of cases with isolates in genetic clusters, 1996 to 2000. Spearman correlation coefficient and probability of correlation between incidence and percentage of cases clustered are given.