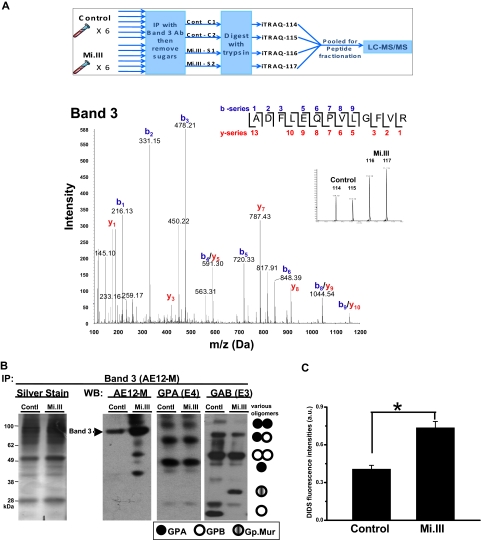
Figure 3.
AE1 expressed more in Mi.III+ RBCs. (A top panel) An outline for the iTRAQ™-based quantitative proteomic method. To compare the composition of AE1-based complexes in Mi.III versus the control, RBC samples were collected from 6 Mi.III+ and 6 control donors, and each subjected to immunoprecipitation and then deglycosylation. The deglycosylated samples were independently digested with trypsin, and then combined for labeling with 1 of the 4 iTRAQ™ reagents. Two pools of 3 control samples and 2 pools of 3 Mi.III+ samples were randomly formed from the 6 donors from each group. The iTRAQ™-labeled peptides from all 4 pools were mixed, fractionated by strong cation chromatography, and analyzed by liquid chromatography–MS/MS. (Bottom panel) A representative fragmentation spectrum on iTRAQ™-labeled AE1. A high-scoring spectrum with overlapping b- and y-series fragment ions assigned to the peptide ADFLEQPVLGFVR (99% confidence) from AE1. (Inset) Expansion of x-axis demonstrates the abundance (area under the curve) of the isobaric tags at 114, 115, 116, and 117 Da. (B) A representative immunoprecipitation experiment using AE12-M antibody. Equal protein quantities of ghost lysates (m/m) from 6 to 8 donors per group (control vs Mi.III) were pooled for immunoprecipitation. One-tenth of the immunoprecipitate (vol/vol) was loaded for immunoblot comparison. The IP experiment has been repeated 7 times and confirmed by another anti-AE1, BRIC170 (data not shown). (Left) Silver stain of the AE1 immunoprecipitates from Mi.III and the control groups. (Right) Immunoblots for AE1, GPA, and GAB (E3). More AE1 was expressed by Mi.III+ cells, whereas the levels of GPA and GPB/Gp.Mur were not significantly different between the 2 groups. (C) DIDS labeling of AE1 was significantly higher in Mi.III+ than the control erythrocytes. Fresh erythrocytes from 3 donors per group were labeled with DIDS. The background fluorescence intensities from the unlabeled erythrocytes were subtracted. Data are expressed as mean ± SE; *P < .01.

