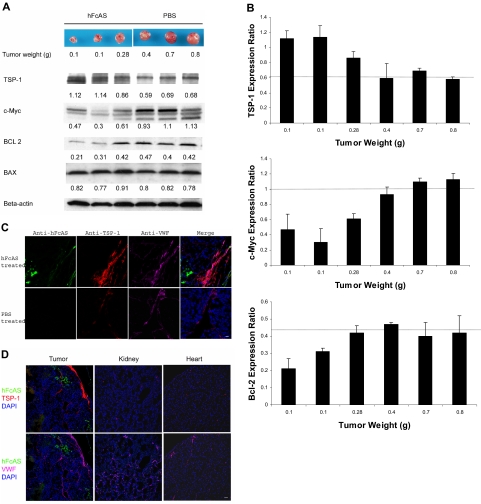
Figure 2.
Angiostatin treatment of tumor-bearing mice affects the expression of several proteins. (A) Tumors reaching the sizes and weights of 0.1 to 0.8 g after treatment with angiostatin or PBS. Equal amounts of protein extracts from tumors were subjected to Western blot analysis with antibodies against TSP-1, c-MYC, BCL-2, BAX, and β-actin. TSP-1 levels shown increased and c-Myc expressions decreased after angiostatin treatment. Relative amounts are indicated by the ratio of each protein to the corresponding level of β-actin (B). The intensity of the protein bands was quantitated by densitometry and normalized against that of β-actin. (C) Immunostaining of the aforementioned tumor sections after incubation with antibodies directed to TSP-1 and VWF, followed by Alexa 568 anti–rat and Alexa 647 anti–rabbit IgG. The TSP-1 (red) was overexpressed in tumor vessels (pink). hFcAS (green) could be detected by Alexa 488 anti–human IgG. Bar represents 20 μm. (D) Large-scale sections showed that after treatment TSP-1 is overexpressed only in tumor site but not in normal organs. Bar represents 100 μm.

