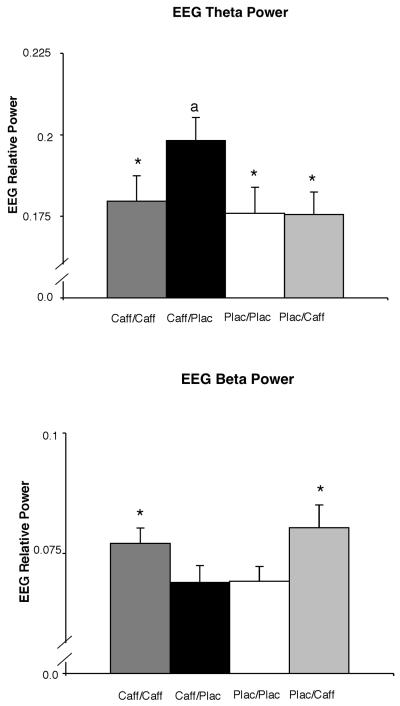
Figure 2.
Effects of the four drug conditions (caff/caff, caff/plac, plac/plac, plac/caff) on EEG relative power for theta (top panel) and beta 2 (bottom panel). The y-axis is presented on a smaller scale that represents a physiologically reasonable range for cerebral blood flow velocity and allows more detailed inspection of the data (normative range is .10-.35 for relative theta and .05-.20 for relative beta). Other details are as in Figure 1.

