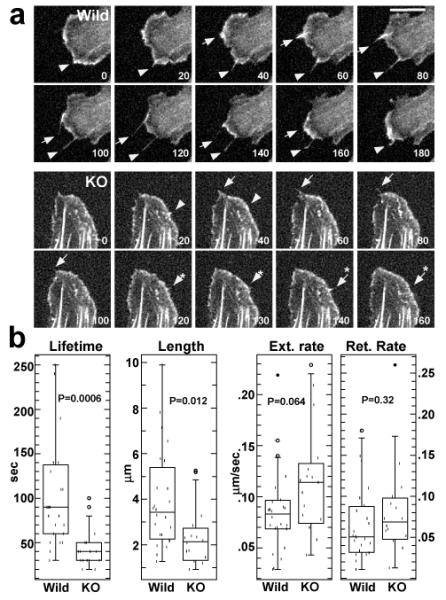
Figure 5.

Live cell imaging of filopodia dynamics shown by wild type and fascin1-deficient embryonic fibroblasts. a. Still images taken from live cell imaging. Numbers are in sec. Note that wild-type filopodia are longer and the lifetimes of two filopodia are 180sec (indicated by arrowhead) and 140sec (arrow). In contrast, filopodia of knockout fibroblasts (indicated by arrow, arrow with asterisk, arrowhead, arrowhead with asterisk) are shorter and short-lived. Their lifetimes ranged from 20sec to 60sec. Bar, 10μm. b, box plot analyses of lifetimes, length, extension and retraction rates of filopodia (n=24 for wild-type, n=16 for knockout).
