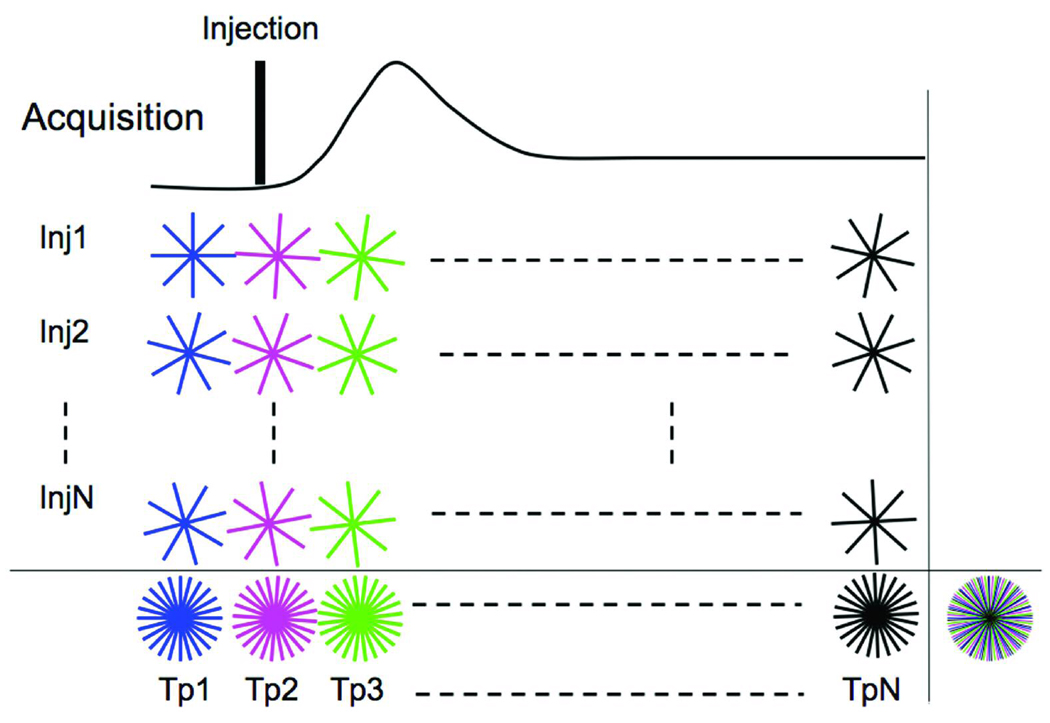
Fig 2.
IRIS acquisition scheme for DCE-MRI. Data is acquired over multiple injections (Inj1-InjN). The sequence differs from that in Figure 1, since the trajectories for each time-point for a given injection are no longer identical. Instead, each set of radial lines is rotated by a small increment (Δϕ) with respect to the trajectories of the previous time-point. Last row shows the k-space sampling pattern created when information from multiple injections is combined. Time-compressed k-space sampling distribution created by combining all k-space lines acquired throughout the acquisition over multiple injections and multiple time-points is shown the extreme right bottom. The different colored lines indicate the different time-points. Each radial line acquired throughout the acquisition is unique.

