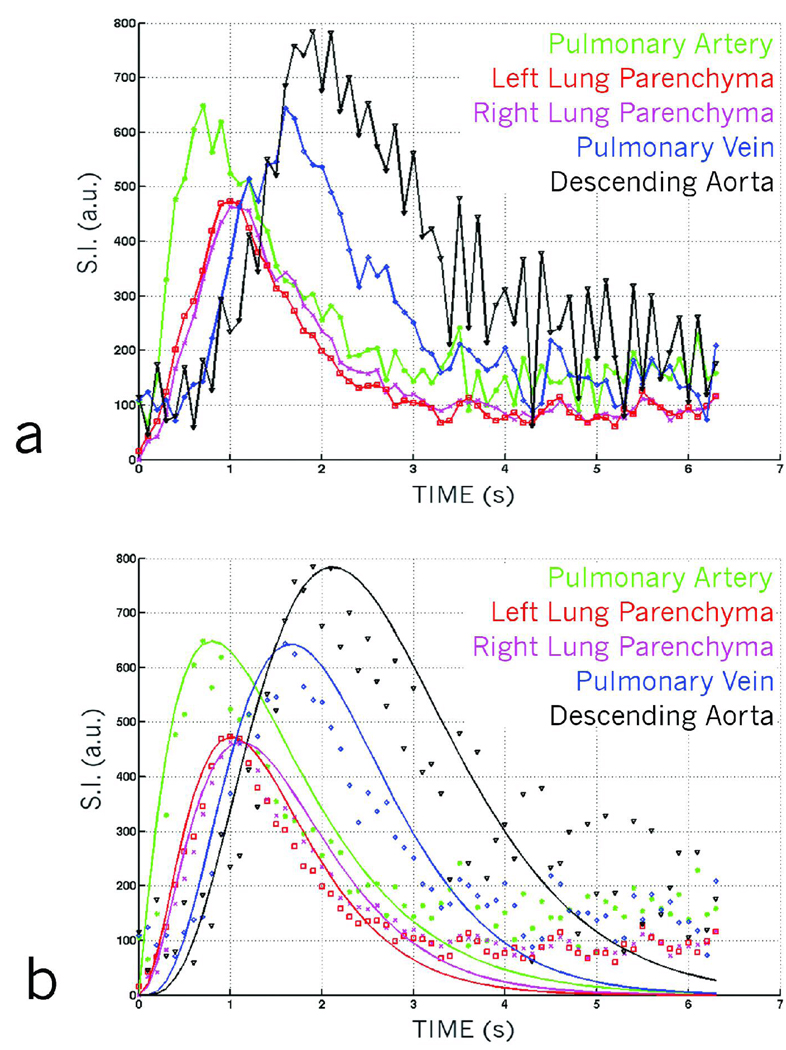
Fig 5.
(a) Dynamic first-pass curves created from a dynamic RA dataset using 8 injections to improve temporal resolution. First-pass curves are created by selecting regions of interest over various parts of the cardio-pulmonary circuit. The curves show subtle variations in different regions such as the pulmonary artery, the parenchyma, the pulmonary veins and the descending aorta. (b) Dynamic first-pass curves shown in 5a, fitted with gamma variate curves providing quantitative information about pulmonary perfusion.

