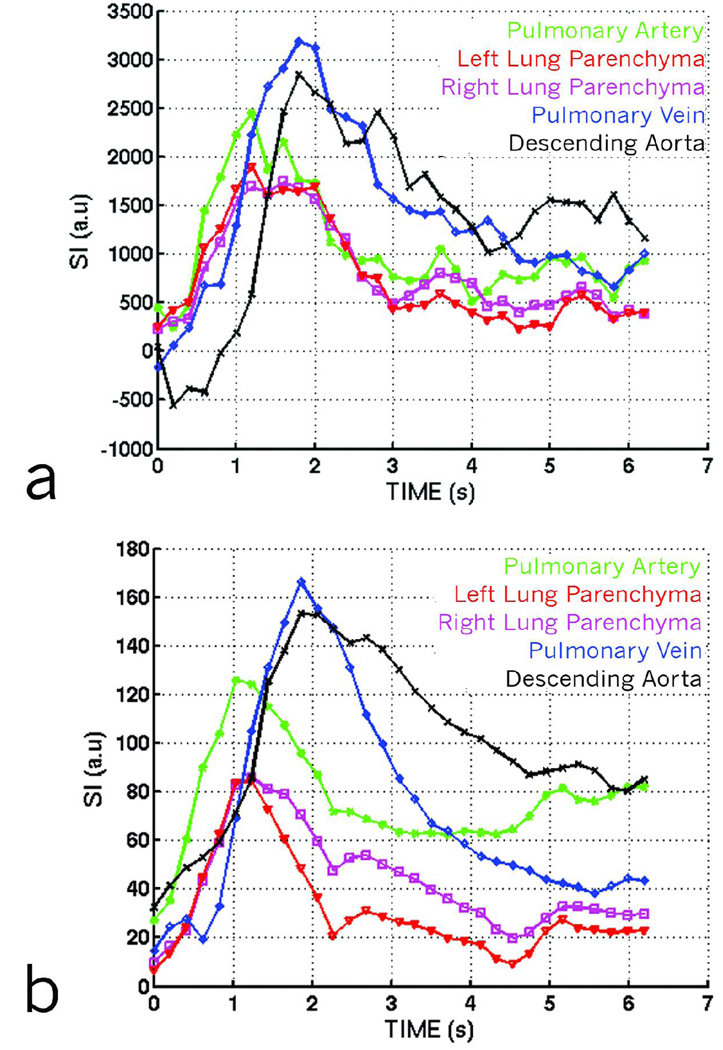
Fig 9.
(a) Dynamic first-pass curves, scanned using dynamic RA, created by selecting regions of interest over various parts of the cardio-pulmonary circuit. (b) Dynamic first-pass curves, scanned for the same animal using IRIS, created by selecting regions of interest over various parts of the cardio-pulmonary circuit. The curves are comparable as far as their times to peak are concerned. The variability is attributed to the difficulty in selecting regions for the dynamic RA dataset due to its very coarse resolution.

