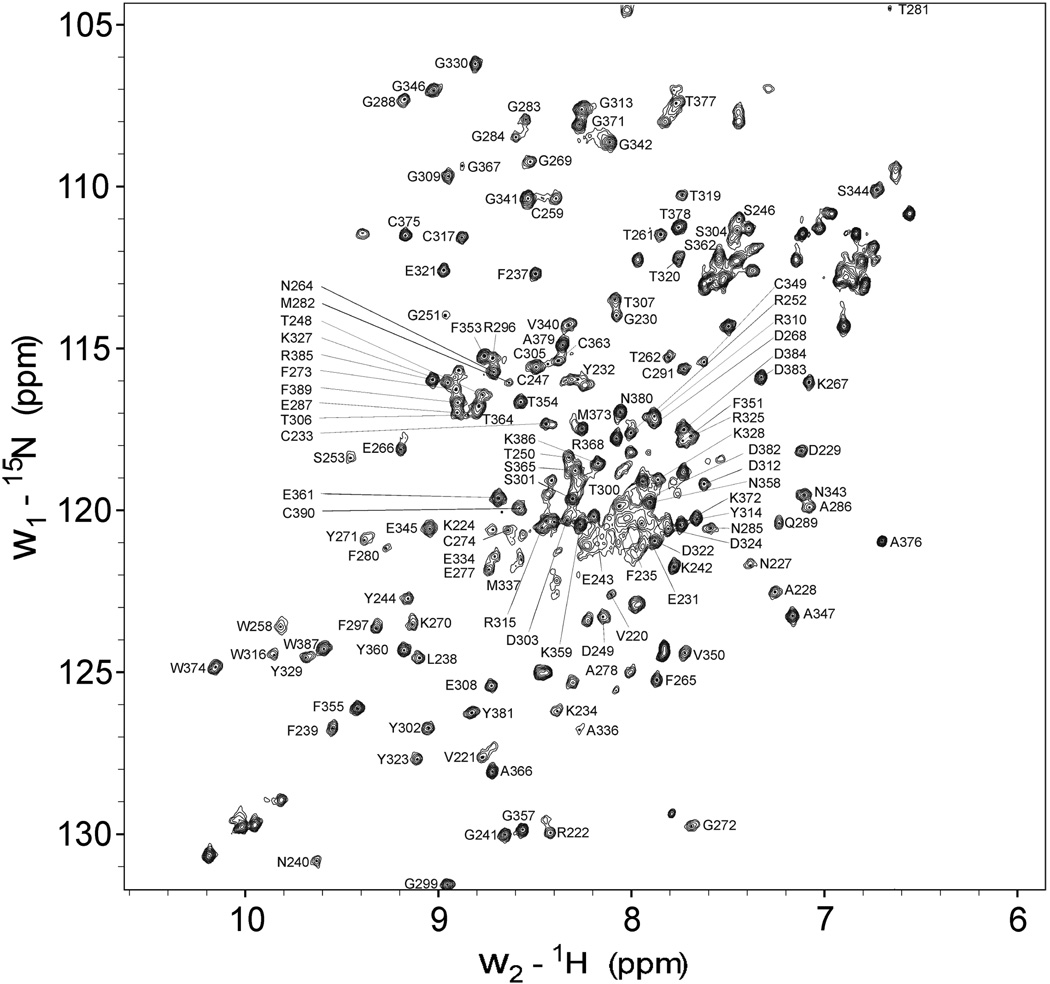
FIGURE 1. 1H/15N HSQC spectra of rCBD.
Purified rCBD was in 25 mM sodium phosphate, pH 7.0, with 5% D2O/H2O at a concentration of 0.5 mM. Spectrum were acquired at 25 °C using a 700 MHz Bruker spectrometer. Assigned peaks are indicated by their one letter amino acid code and residue number based on proMMP-2 (1CK7 in PDB database). Residues of the His-tag of CBC were not labeled.

