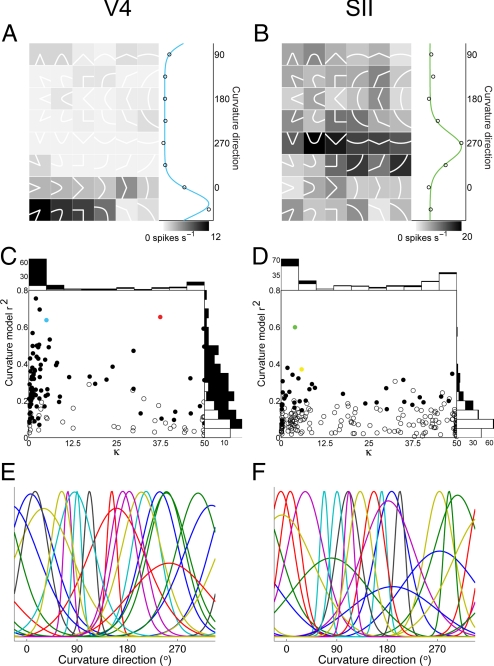
Fig. 1.
Tuning for curvature direction in visual and somatosensory cortex. (A) Example neuron from macaque visual area V4. Contour fragment stimuli (shown here as white icons) were flashed in the cell's receptive field while the monkey performed a fixation task (see Materials and Methods). Background gray-level indicates average response to each stimulus (see scale bar). Marginal plot at right averages responses across rows of stimuli projecting in the same direction (open circles). The fitted von Mises function (blue curve) explained a substantial fraction of total response variance (r2 = 0.64). (B) Example neuron from macaque somatosensory area SII. Embossed tactile stimuli were indented into the distal finger pad of a monkey performing a distraction task (see Materials and Methods). The fitted von Mises function (green curve) explained a substantial fraction of total response variance (r2 = 0.60). (C) Distribution of curvature direction tuning in area V4. Neurons with (filled circles) and without (open circles) significant tuning (randomization test, P < 0.05; see Materials and Methods) are plotted with respect to variance explained (vertical axis) and selectivity (κ) for von Mises function fits. Larger values of κ signify sharper tuning. The example V4 neurons from Fig. 1 (blue) and Fig. 2 (red) were significantly tuned. Marginal histograms show numbers of tuned (filled) and untuned (open) neurons. (D) Distribution of curvature direction tuning in area SII. Conventions as in panel C. The example SII neurons from Fig. 1 (green) and Fig. 2 (yellow) were significantly tuned. (E and F) Example curvature direction tuning functions from 20 V4 (E) and 20 SII (F) neurons. Baseline-subtracted fitted von Mises functions are shown for each neuron.

