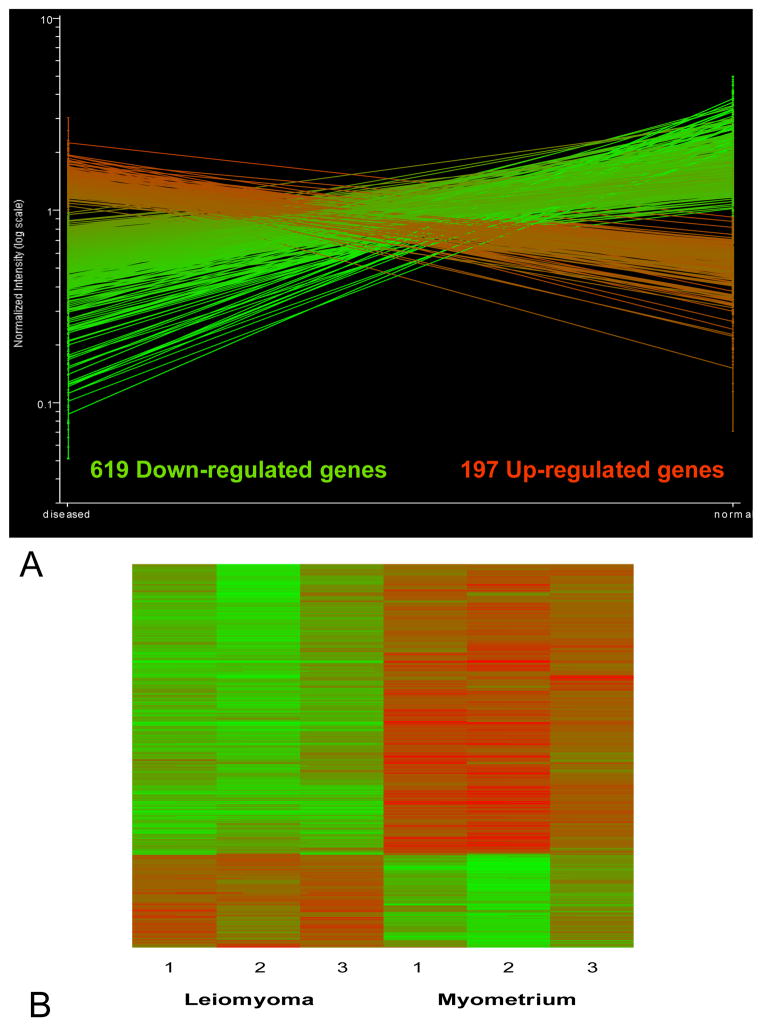
Figure 1.
A. The statistically significant differentially expressed genes that exhibited consistent changes in all 3 tumors relative to normal myometrium of a magnitude of at least 2 fold. B. Heat map showing cluster analysis of the differentially expressed 816 genes in 3 uterine leiomyoma and 3 samples of matched adjacent normal myometrium. From left to right the first 3 columns represent the 3 tumors followed by the corresponding normal tissue. Rows represent individual genes. Red, increased gene expression; green, decreased gene expression. The color intensity is proportional to the hybridization intensity of a gene from its median level across all samples.

