Figure 2.
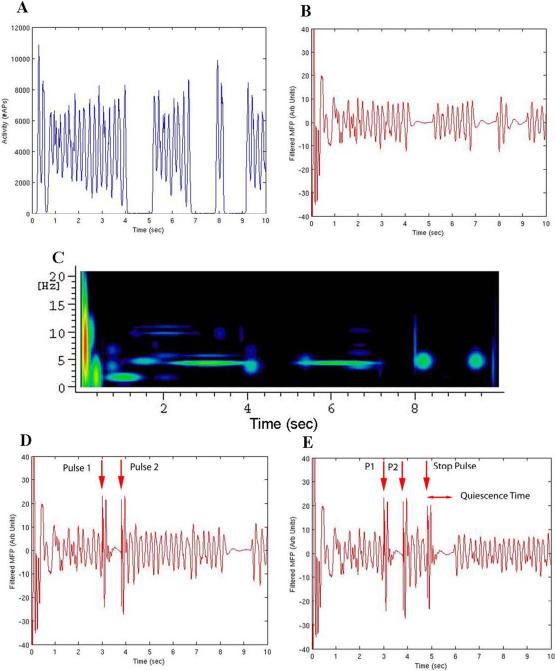
(A-C) Model with no stimulation applied, same connection pattern as used in stimulation studies. (A) Summed Layer II/III pyramidal cell action potentials in 10 msec bins. (B) Filtered mean field potential. (C) MP analysis. (D) Filtered mean field potential of the same simulation with a stimulation pulse applied at 3.00 sec stopping the ongoing bursting activity. A second stimulation pulse at 3.8 sec is used to restart a stable long bursting period. Red arrows above the plot demonstrate the stimulation points. (E) Filtered mean field potential of the same pulse sequence, now with a further 3rd stimulation pulse (stop pulse) used to investigate the phase dependence of stimulation-induced activity alteration. Red arrows above the plot demonstrate the stimulation points.

