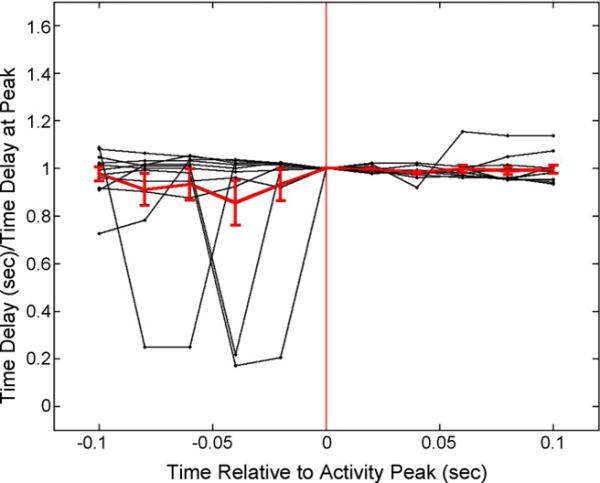
Figure 4.

Plot of the five sampled quiescence times before and after each of the MFP peaks examined. Times are relative to the peak in the MFP. The vertical red line additionally indicates the peak location. The average of these 11 peri-peak measurements (± sem) is shown in red. There were no statistical differences in these values based on matched t-testing.
