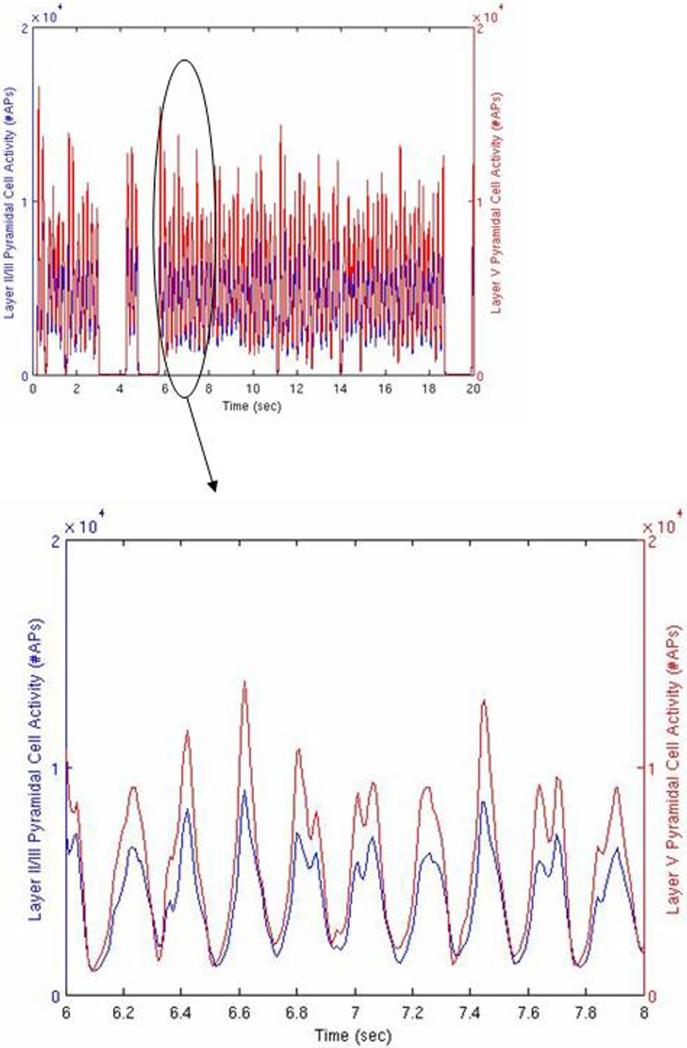
Figure 5.
Network activity with no stimulation, 10 second simulation. Red line indicates summed action potentials in 10 msec bins for the Layer II/III pyramidal cells as a function of time. Blue line indicates the same for the Layer V pyramidal cells. Inset is the data presented in more detail from the 6.0 to 8.0 second region.

