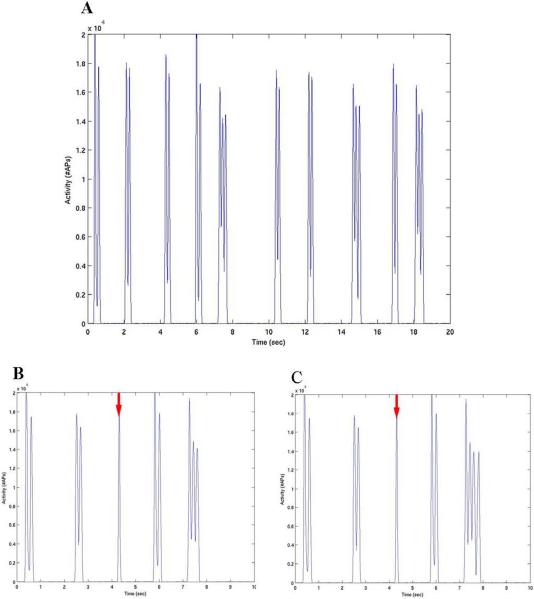
Figure 6.
(A) Network activity utilizing a model with excitatory chandelier cells. The synaptic weights used were the same as Layer II/III pyramidal cell excitatory connections. Note the more synchronous bursting pattern produced with a distributed background source, compared to the previous simulations. (B,C) Single stimulation pulses were applied at 4.308 sec (B) and 4.313 sec (C) on the underlying activity presented in (A). Stimulation times marked by the red arrow. Note the disruption of the bursting period between 4 and 5 seconds and the alteration of the subsequent bursting behavior compared to (A).

