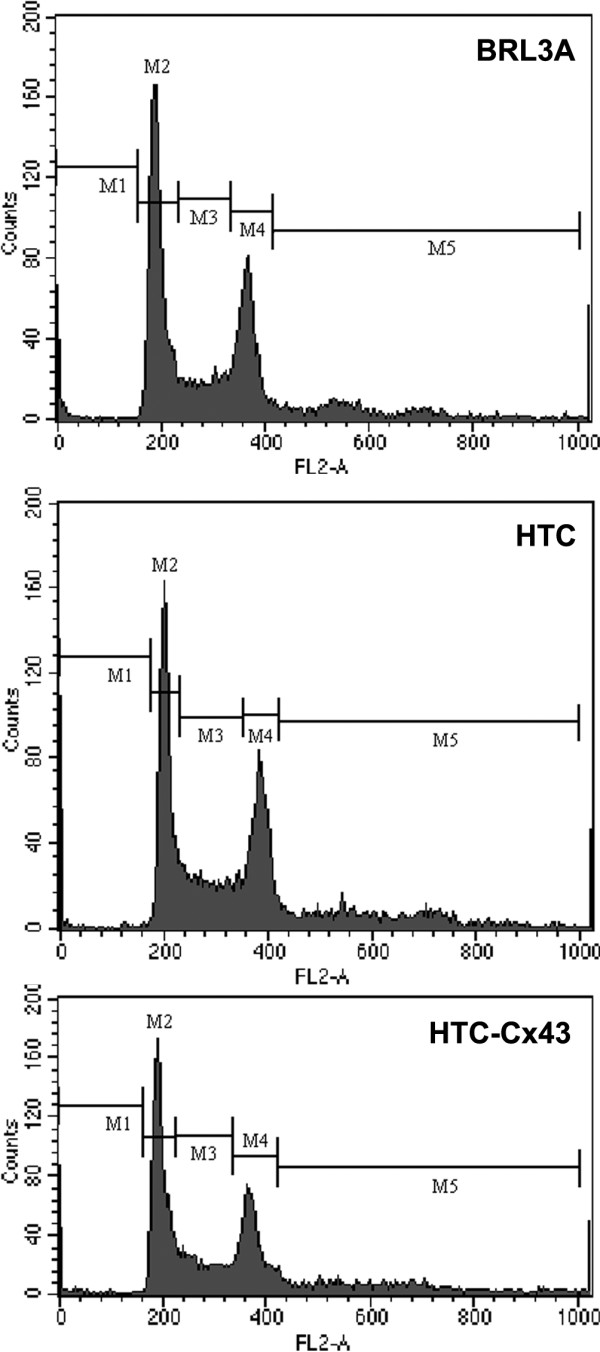
Figure 3.

DNA distribution histograms obtained from Flow cytometry. The cell population in the s phase corresponding to 18%, 27.5% and 22% to BRL3A, HTC and HTC-Cx43 cell line, respectively. The data shown are representatives of three independent experiments.
