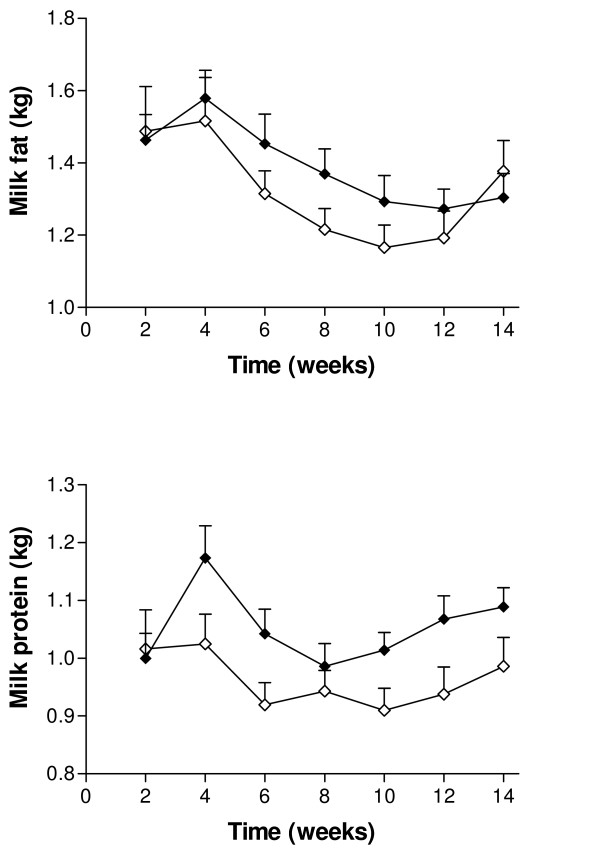
Figure 2.
Mean daily milk fat and protein production in Saccaromyces cerevisiae and control group. Mean (± SEM) daily milk fat (above) and milk protein (below) during the first 14 weeks from parturition (measured every second week) in cows from the Saccaromyces cerevisiae group (♦; n = 22) and control group (◊; n = 17).

