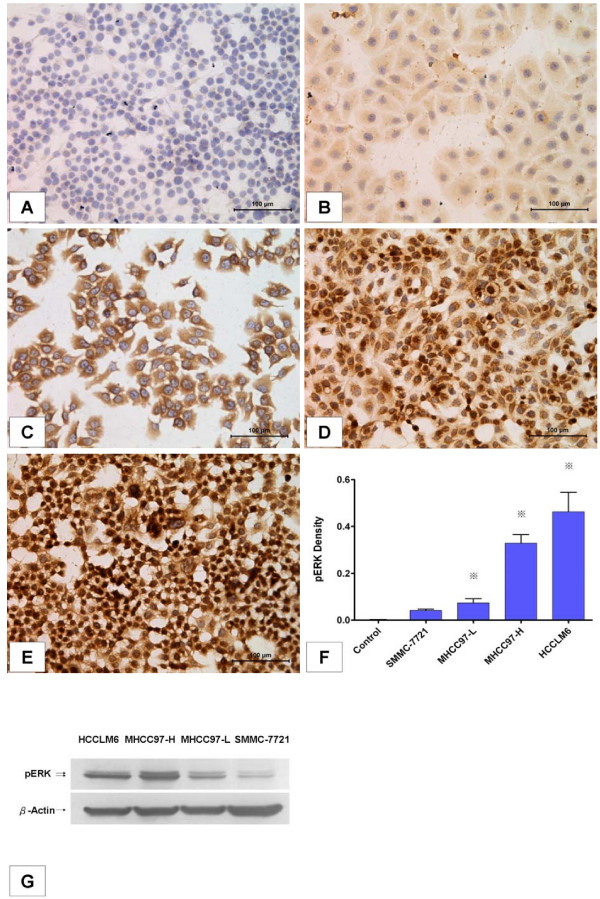
Figure 1.
Basal pERK levels in hepatocellular carcinoma (HCC) cell lines increased stepwise in accordance with their metastatic potential. (A-E) Immunocytochemical staining of pERK (200×). (A) Negative control. (B) SMMC-7721. (C) MHCC97-L. (D) MHCC97-H. (E) HCCLM6. (F) Quantification of basal pERK levels in different HCC cell lines. pERK density was quantified using Image-Pro Plus version 6.2 software as described in Materials and methods. Columns represent means of six samples in each group; bars indicate standard deviation; *, P < 0.05, when compared to the negative control. (G) Western blot analysis of pERK protein in different HCC cell lines.

