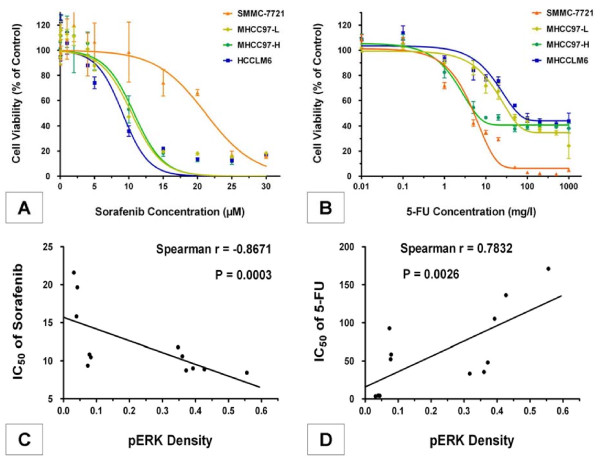
Figure 4.
Effects of sorafenib and resistance to 5-fluorouracil (5-FU) were significantly correlated with basal pERK levels in hepatocellular carcinoma (HCC) cell lines. (A) Sorafenib inhibited cell proliferation in different HCC cell lines. (B) 5-FU inhibited cell proliferation in different HCC cell lines. Each value represents the average of four independent determinations with four replicates per experiment. Bars indicate standard error. (C) Correlation analysis between the IC50 values of sorafenib and pERK density values. (D) Correlation analysis between the IC50 values of 5-FU and pERK density values. The IC50 value, at which 50% of cell growth is inhibited compared with control, was calculated by nonlinear regression analysis using GraphPad Prism version 5.0 software. pERK density was quantified using Image-Pro Plus version 6.2 software as described in Materials and methods. Spearman's rank correlation method was used for correlation analysis between pERK density values and drugs' IC50 values of three independent experiments for four cell lines with four replicates each. P < 0.05 was considered significant.

