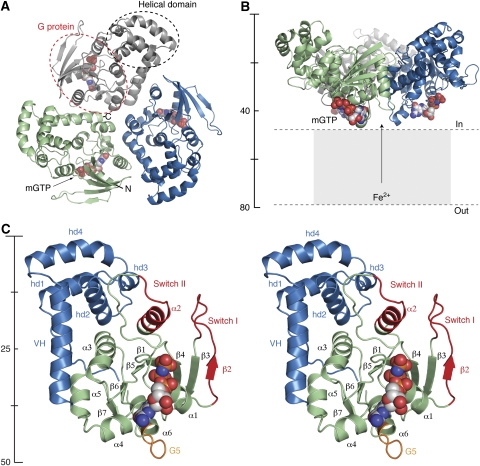
Figure 1.
Overall structure of FeoB1−270. (A) Ribbon representation of the trimer viewed from the intracellular space. Individual protomers are coloured in grey, green, and blue. Dotted lines indicate the spatial organization of the G protein and helical domain. (B) Side view of the trimer, with colours as in (A). The mGTP molecule is shown as space-fill. (C) Stereo view of one protomer. The N-terminal G protein and helical domain are illustrated in green and blue, respectively. The Switch regions are shown in red, and the G5 motif is depicted in orange. All structural figures were made using PyMOL (http://pymol.sourceforge.net).

