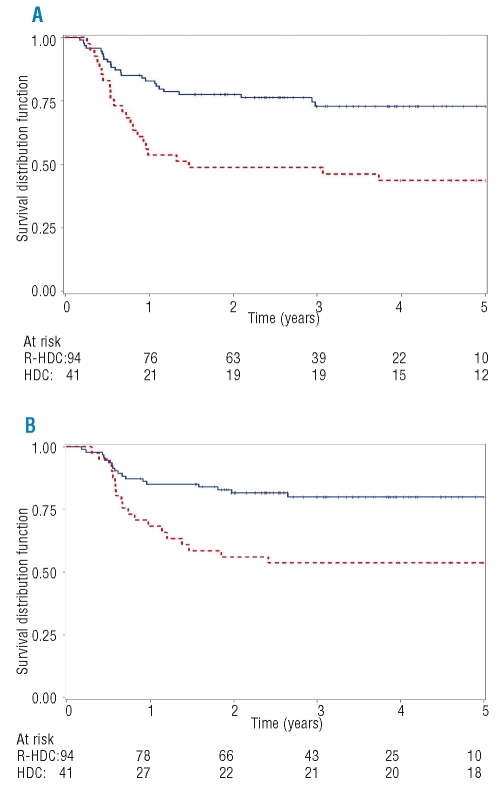
Figure 3.
FFS and OS, by study group. The 4-year FFS (A) and 4-year OS (B) for the R-HDC study group (blue solid line) and the HDC historical control group (red dashed line). (A) FFS at 4 years: R-HDC study group 73%; HDC historical control group 44%. Hazard ratio= 0.39 (95% CI: 0.22–0.69, p=0.001) (B) OS at 4 years: R-HDC study group 80%; HDC historical control group: 54%. Hazard ratio= 0.37 (95% CI: 0.19–0.71, p=0.002).

