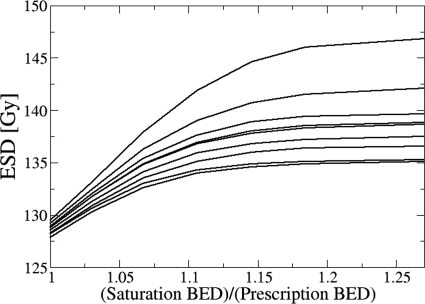
Figure 2.
ESD for a combination of EFEB (59 Gy in 2 Gy fractions) and HDR (9 Gy) plotted as a function of saturation BED, , normalized to the total prescribed BED. Each curve denotes one of the nine patients. Note that the shape of this plot does not depend on the dose delivered by the prior treatment, as long as the prior dose distribution is uniform. Any uniform distribution of the prior dose adds a constant to the ESD.

