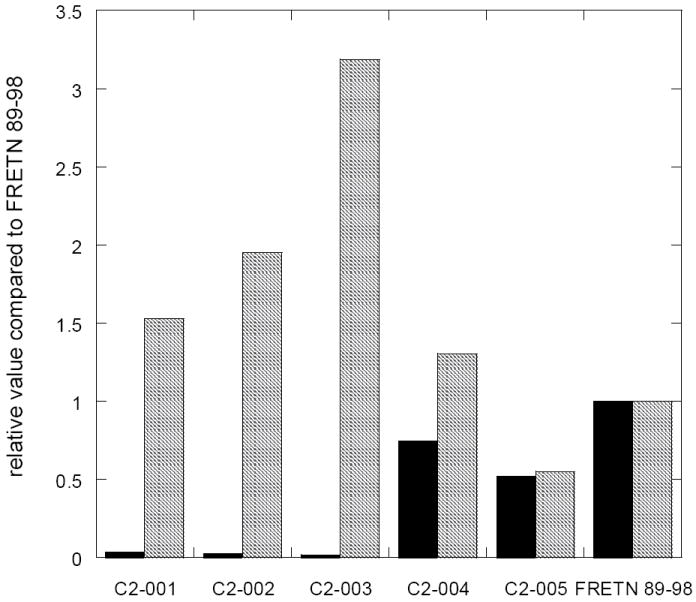
Figure 5. The P3, P1 and P3’ positions are crucial for determining substrate specificity.

The kcat (■) and Km ( ) values for ATP-dependent cleavage of the Class II peptides (Table 3) by E. coli Lon are compared. The rates of peptide cleavage were determined using the fluorogenic peptidase assay described in materials and methods in the presence of 150 nM Lon monomer, various concentrations of the indicated peptides and 500 μM ATP. The Km values vary slightly among the peptide substrates but the kcat values exhibit significant reduction when > 1 Ala substitution are introduced into the peptide substrate.
