Figure 1.
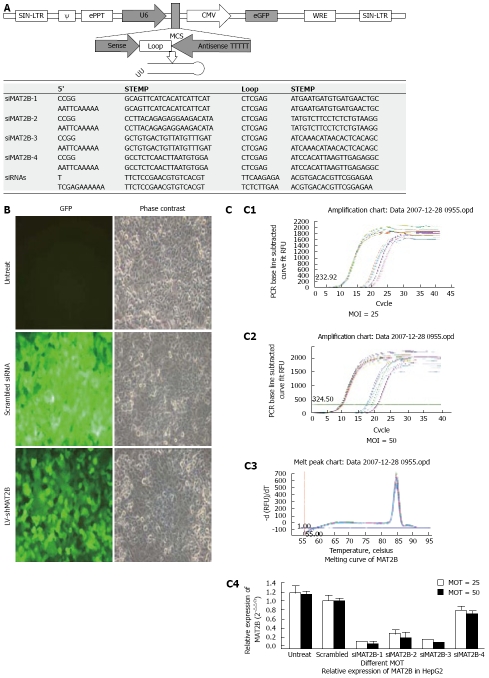
A: Each consist of a hairpin as was demonstrated; B: HepG2 cells were without treatment (untreated), and infected with control lentivirus (scrambled siRNA) or LV-shMAT2B. The cells were infected (MOI = 25), GFP expression and the phase contrast images of the same areas were taken after 72 h. C: msRNA level of MAT2B after HepG2 cell was treated with LV-shMAT2B in different MOI (C1 and C2) detected by real-time PCR (C4), melting curve of MAT2 B (C3).

