Abstract
We report for the first time the infrared spectra of individual human cervical cancer (HeLa) cells suspended in buffer or cell culture medium. Although we did not establish whether these cells were viable at the time of spectral data acquisition, we believe that the methodology used is applicable to the study of live cells. Data were collected either from entire cells, using 25- to 40-µm apertures, or via an imaging approach, where pixels measuring 6.25 × 6.25 µm were assembled to form a map of a cell in suspension. Measurements were carried out both in reflection/absorption and in transmission modes. The results reported here might have far-reaching implications for the use of infrared microspectroscopy to monitor cell proliferation, drug response, and other cell biological parameters in live cells.
Keywords: infrared microspectroscopy, live cancer cells, water background compensation
INTRODUCTION
The process of cell division is a complex sequence of preprogrammed events—known in cell biology as the cell cycle—that results in the creation of two identical progeny cells from one cell. This process, which requires about 24 h, is initiated by biochemical signals and causes drastic changes in a cell’s size, composition, energy metabolism, etc. In 1999, the first Fourier transform infrared (FT-IR) results were published that indicated that spectral variations accompany the stages of the cell cycle.1 The motivation for this original study was twofold. First, the spectral analysis of exfoliated cells for the diagnosis of cervical disease revealed large spectral heterogeneity, which could—at least partially—be partially explained by the variations of cellular spectra during the division cycle. Second, the differences observed between normal and cancerous regions of biopsy tissue sections can be understood in terms of the spectral variations observed during the cell’s division cycle. These differences may be due to varying abundances of dividing cells in cancerous samples, which, in turn, affect the average spectra observed in a “pixel” of tissue biopsy.
Up to now, spectra of individual cells were reported for cells dried and/or fixed on infrared (IR) transparent or reflecting microscope slides. Similarly, spectra of tissue areas were collected for dried, fixed, or unfixed tissue sections. For the in vivo spectroscopic method of diagnosis, the detection of spectral changes during a cell’s division cycle in live cells is of prime importance. IR spectroscopy of cells in an aqueous environment is difficult because of the very strong water vibrations that interfere with the protein amide I, II, and A vibrations. In this article, we report microscopically acquired IR spectra of individual cells suspended in buffer solution or growth medium.2
EXPERIMENTAL
Cell Culture/Sample Preparation
HeLa cells (cell line CCL-2, ATCC, Manassas, VI) were grown in 75-cm2 cell culture bottles (Sigma–Aldrich, Milwaukee, WI) at 37°C in a 5% CO2 atmosphere in minimum essential Eagle’s medium supplemented with 10% (by volume) fetal calf serum (both from ATCC). Cells were removed from the bottles by trypsin–EDTA (ATCC), washed repeatedly, and resuspended in buffered saline solution, BSS (ATCC).3
For reflection/absorption measurements (see below) of live cells, a drop (90 µL) of cell suspension in BSS was placed on a low-e slide, and a CaF2 or BaF2 coverslip was carefully placed on top of the drop. A Teflon spacer (5 µm thickness) was used to keep the coverslip separated from the low-e slide, producing a total path of 10 µm. Low-e slides (Kevley Technologies, Chesterfield, OH) are glass microscope slides that are coated, on one side, with a thin Ag layer, covered by SnO2. They are chemically inert and nearly transparent to visible light. However, they reflect incident midinfrared radiation nearly completely. Thus, they are an ideal substrate for infrared microspectroscopy, since visual images and IR spectra can be collected from the same sample.
For transmission measurements of live cells, a drop of cell suspension in growth medium was placed into a 6-µm-pathlength CaF2 liquid cell (Biotools, Inc., Wauconda, IL). The flat window of this cell was replaced by a thinner 25 mm diameter × 2 mm thickness CaF2 window. Larger cells may have been compressed and ruptured in the preparation of the cells in suspension, but small cells appear to be intact. Care was taken to collect spectral data within minutes of sample preparation in order to minimize effects of cell degradation.
Spectral Measurements
All reflection/absorption spectra of cells suspended in buffer reported in this study were recorded using an IlluminatIR IR microspectrometer, manufactured by SensIR, Inc. (Danbury, CT). Details of this spectrometer are presented in the accompanying paper.3 A fixed circular aperture of 25 µm was used. A total of 300 or 600 interferograms, collected at 4 cm−1 spectral resolution, were coadded and Fourier-transformed. A total of 600 interferometer scans can be collected in about 5 min.
Transmission spectral maps of individual cells suspended in growth medium were collected using a Perkin–Elmer Spectrum One/Spotlight 300 microspectrometer. Spectra were collected either in “mapping mode” using the 16 × 1 detector array at 6.25 × 6.25 µm2 spatial resolution or using the single detector and an aperture adjusted to straddle the cell. A total of 128 scans at 4 cm−1 spectral resolution were coadded before Fourier transform.
In this study, the sample cell was at room temperature and the viability of the cells was not established. However, spectra were collected immediately after cells were placed into the sample compartment, and data acquisition was repeated every 30 min for 3 h. During this time, no spectral changes were observed for the cells.
RESULTS
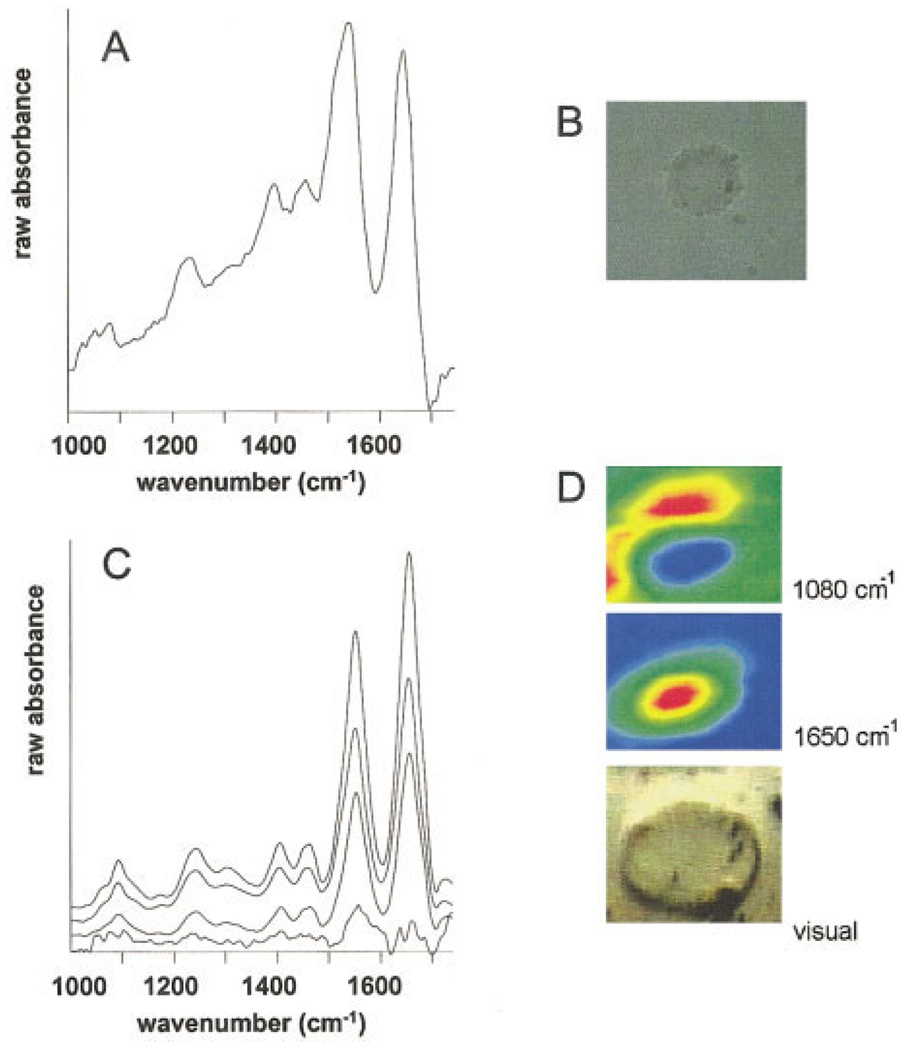
Figure 1A shows the reflection/absorption spectrum of a cell suspended in BSS, and Figure 1B shows a visual image of this cell taken through the objective used for IR data acquisition. Although this cell may have been compressed in the sample preparation process, we believe that the spectrum is representative of live cells. The unusual amide I/II band profile shown in Figure 1A is an artifact due to overcompensation for the water background, which will be discussed in the next section. Figure 1D shows a visual image and spectral maps, collected in transmission mode, for an individual cell (>40 µm diameter) suspended in cell culture medium.4 The spectral images are based on raw IR intensities at the indicated wavenumber. Representative raw spectra from this map are presented in Figure 1C. The longer effective path in the refection/absorption experiments, compared to the transmission experiments, accounts for the larger distortion in the amide I/II envelope. To our knowledge, these data represent the first observation ever of spatially resolved IR data of a cell in its native environment.
FIGURE 1.
Reflection/absorption spectrum (A) and visual image (B) of a HeLa cell in BSS buffer. Absorption spectra (C) and spectral and visual images (D) of a HeLa cell in growth medium. In D, blue hues correspond to the lowest and red hues to the highest intensity of the selected features.
DISCUSSION
The spectra of cells suspended in buffer or growth medium reported here suggest that IR spectroscopy of live cells is possible once the cells are kept at 37°C and are the first indication of the spectral features expected for live cells. This paper is a preliminary report of these results and will not address issues associated with establishing the viability of these cells.
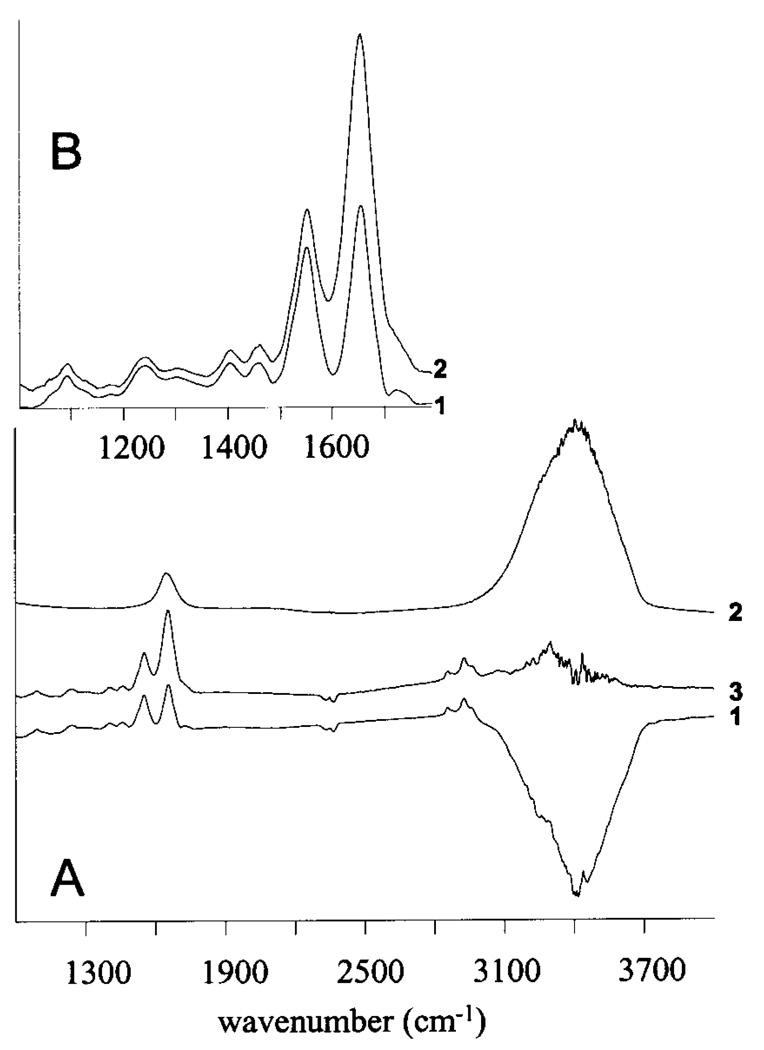
We first wish to discuss the unusual amide I/II envelope collected from cells in suspension, which has been observed by other researchers as well.5,6 This band shape is due to the fact that the cell contains less water than the surrounding medium or buffer. Consequently, the calculated absorption spectra are overcompensated for the liquid water background.7 This can be avoided by scaling the amplitude of the buffer spectrum when the sample absorbance spectrum is computed or by adding a scaled buffer spectrum to the raw absorption spectrum of the sample. Since the exact difference in water content of the cell and the medium is unknown, both procedures are based on visual fitting, until the corrected spectra display a more normal amide A envelope. This is shown in Figure 2A: trace 1 shows the raw absorption spectrum of a cell, using the unscaled spectrum of the growth medium (trace 2) for a background. The 3400–3700 cm−1 region in the resulting raw absorption spectrum is overcompensated for the growth medium spectrum. By scaling the growth medium spectrum, a spectrum (Figure 2, trace 3) results that exhibits positive amide A intensity. In this corrected spectrum, the amide I and II profiles appear with nearly normal band profiles, as shown in Figure 2B.
FIGURE 2.
Effect of water overcompensation for the amide I and II contours of cells suspended in medium. See text for details.
Spectral maps based on the 1650 (protein) and 1085 cm−1 (phosphate) spectral peaks are shown in Figure 1D. The protein map shows the highest amide I intensity in the nucleus. This behavior was observed previously for maps of single (dried) cells,8 where the sample thickness is highest in the nucleus. Here, however, the path length is constant, indicating that the high protein signal is due to the large protein concentration in the nucleus, rather then a pathlength effect.
The spectra of the cell in growth medium show a sharp band in the symmetric phosphate stretching region (1085 cm−1) with relatively large intensities throughout the nucleus and the cytoplasm. Although this band was observed for all cells in growth medium (and not for cells in BSS), it is not due to the growth medium itself, which has no spectral features in this region. In addition, this peak was also observed in dried cells that were grown, rather than spin-deposited, on substrates.3 The identity of this compound is currently unknown, but its presence in both cytoplasm and nucleus suggests RNA, phosphates such as ATP, phosphorylated proteins, or others that are particularly prevalent in metabolically active cells.
CONCLUSIONS
We demonstrate that it is feasible to collect spectral data from cells suspended in an aqueous environment. The spectral quality, even at high spatial resolution, is excellent and suggests that spectroscopy of living cells can be accomplished. This opens a wide variety of experiments on subjects such as drug uptake, drug mechanism and apoptosis.
Acknowledgments
Partial support of this research from NIH Grants GM 60654 and CA 090346 (to MD) and RR-03037, which supports the infrastructure of the Chemistry Department at Hunter, is gratefully acknowledged. The authors are indebted to SensIR, Inc., for the loan of the IlluminatIR infrared microspectrometer system.
REFERENCES
- 1.Boydston-White S, Gopen T, Houser S, Bargonetti J, Diem M. Biospectroscopy. 1999;5:219–227. doi: 10.1002/(SICI)1520-6343(1999)5:4<219::AID-BSPY2>3.0.CO;2-O. [DOI] [PubMed] [Google Scholar]
- 2.Spectra of cells on a thin layer of growth medium have been reported before. See Holman HY, Martin M, McKinney WR. Tracking Chemical Changes in a Live Cell by SR-FTIR Spectromicroscopy, Paper 72. New Orleans: Pittcon; 2002.
- 3.Romeo M, Matthäus C, Miljkovic M, Diem M. Biospectroscopy. this issue. [Google Scholar]
- 4.Growth medium (ATCC): 4 mM l-glutamine, 1.5 g/L NaHCO3, 4.5 g/L glucose, 10% fetal calf serum.
- 5.Keese M, Pepperkok R, Moss D. Synchrotron IR Spectroscopy of Single Living Human Cells at ANKAIR. First BASIE Workshop, Paper P6; Karlsruhe, Germany. 2003. [Google Scholar]
- 6.Tobin MJ, Chesters MA, Chalmers JM, Rutten FJM, Fisher SE, Symonds IM, Hitchcock A, Allibone R, Dias-Gunsakara S. Synchrotron Infrared Microscopy of Cancer Cells in Whole Tissue and Tissue Culture; First BASIE Workshop; Karlsruhe, Germany. 2003. [Google Scholar]
- 7.Rahmelow K, Huebner W. Appl Spectrosc. 1997;51(2):160–170. [Google Scholar]
- 8.Lasch P, Pacifico A, Diem M. Biopolymers Biospectrosc. 2002;67:335–338. doi: 10.1002/bip.10095. [DOI] [PubMed] [Google Scholar]


