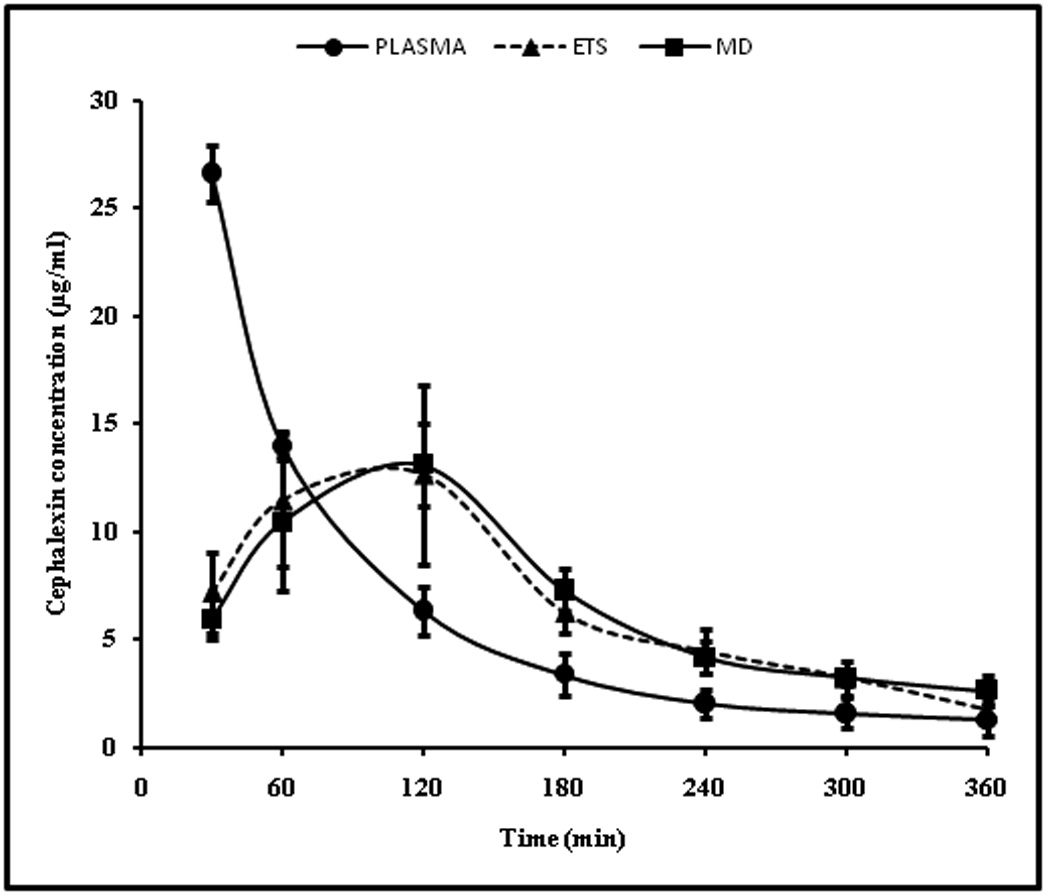
Figure 3.

Time course of cephalexin in rat plasma determined by blood sampling and dermal ECF determined by microdialysis and ETS technique following administration of 20mg/kg cephalexin i.v bolus.The data points represent an average of n=6 ± sd. Blood sampling, ETS and microdialysis sampling were carried out simultaneously on each rat at the same time points.
