
Fig. 6.
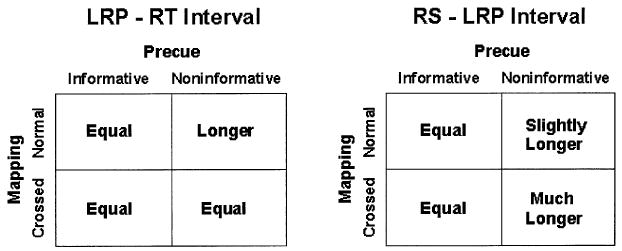
Precue and mapping effects on the LRP-RT (left panel) and RS-LRP (right panel) intervals. LRP intervals are classified in each panel according to mapping (rows) and whether the precue was informative or noninformative (columns). Each cell indicates how the length of the corresponding LRP intervals compares with the length of the intervals obtained with a normal mapping and informative precues (upper left cell).