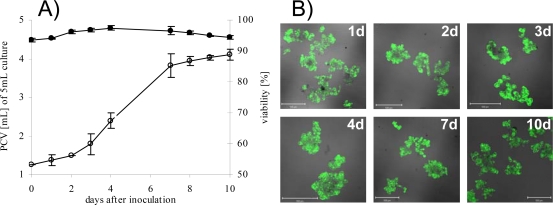
Figure 1.
Growth curve and viability of S2LS3 cell culture.
A) Growth rate as packed cell volume (PCV) out of 5 mL (n=4, open circle). The viability of cell culture was counted after labelling with the vitality dye fluorescine diacetate (FDA) as percentage of living cells (black circle). Error bars represent the standard deviation of mean values. Over 500 cells were counted for calculation (n=2) B) Fluorescence images of different time points. Cell culture was stained with FDA to monitor cell viability and cells emitting green fluorescence were counted as vital. Fluorescence was visualised in a CLSM using a 488 nm laser line in combination with a 505–530 nm band pass filter. The scale bars represent 500 μm on all images.

