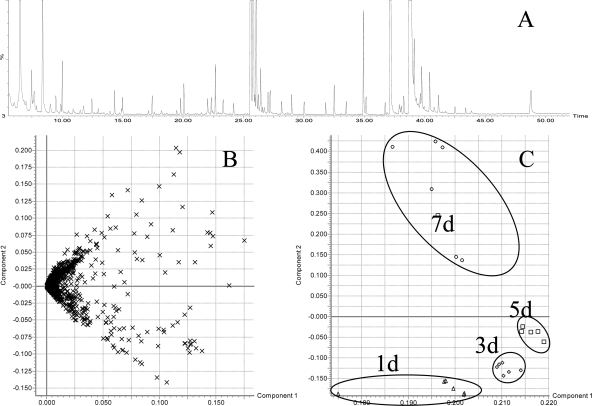
Figure 6.
GC-MS analysis of extracellular metabolite profiles from S2LS3 cell culture medium after derivatisation. Exact mass retention time pairs (EMRT) were used for principle component analysis (PCA).
A) Representative total ion current (TIC) chromatogram at day 7. The y-axis was set to 25% of the base peak. B) Loading Plot from PCA. C) Score Plot calculated from the Loading Plot with component 1 and 2. Samples belonging to the same cultivation time (1d, 3d, 5d, and 7d, n = 6) were marked with black circles.

