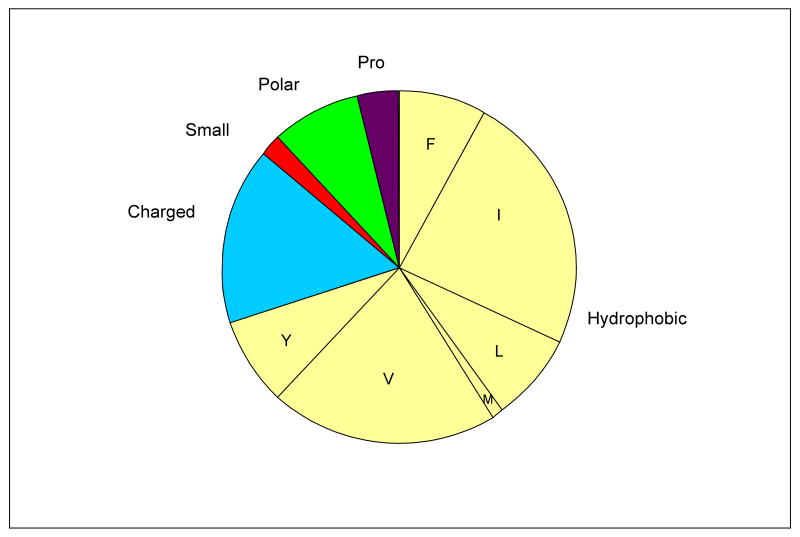
Figure 1.
(a) Diagram showing the nature of residues within all 91 G1G interruptions found in non-fibrillar collagens, where Hydrophobic ( ) = F,I,L,M,V,Y; Charged (
 ) = D,E,H,K,R; Polar (
 ) = Q,N,T; Small (
 ) = A,C,G,S; Pro (
 ).
).
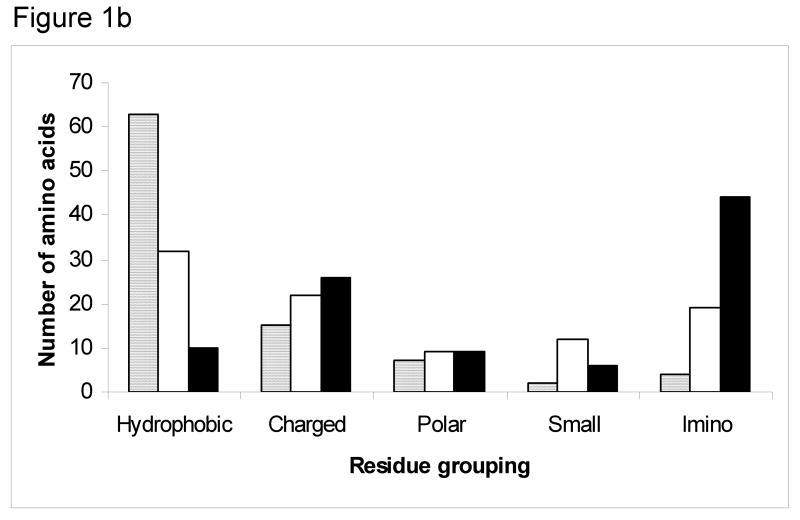
(b) Histogram showing the observed (gray) versus expected frequencies in X1 position (white) and X2 position (black) of groups of amino acids in G1G interruptions in all non-fibrillar collagens. The expected frequencies were calculated based on the identity of amino acids in the X1 and X2 positions of (Gly-X1-X2)n sequences of all 6 chains of type IV collagen. A chi square analysis indicates the observed distribution is very different from that expected for the X1 position (p<0.001) and the X2 position (p<0.001), and the major chi square terms come from the high number of hydrophobic residues and lower than expected number of imino acids.


