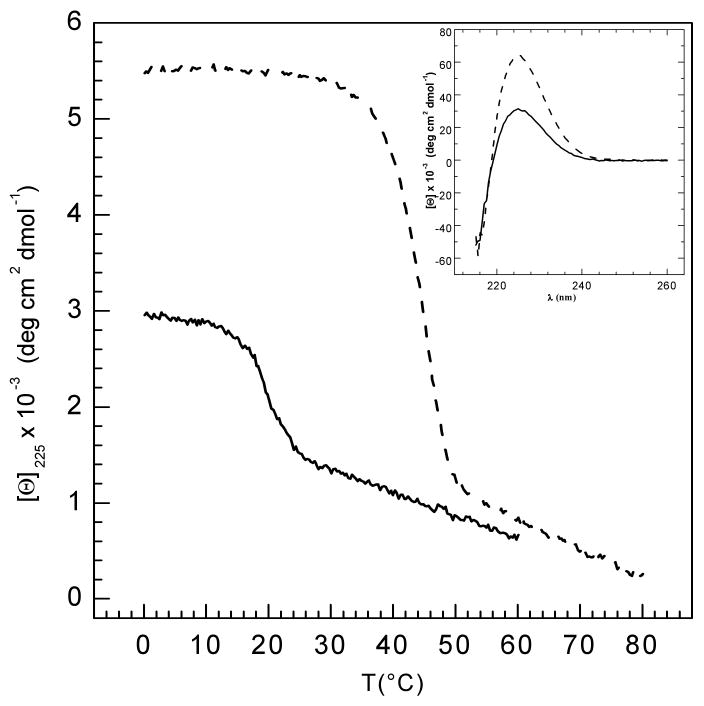
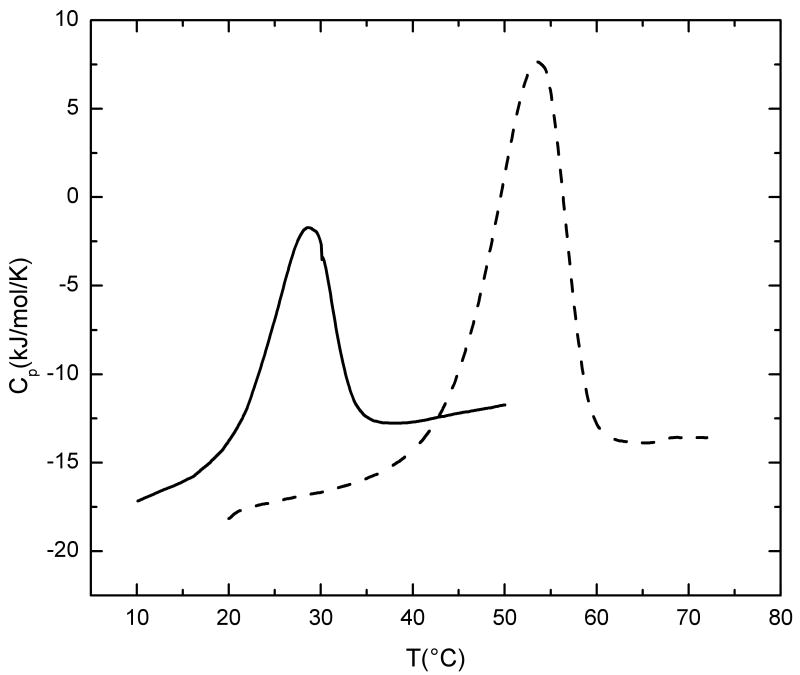
Figure 3.
(a) Temperature-induced denaturation of GF (solid line) and GFO (dotted line) peptides monitored by circular dichroism spectroscopy at 225 nm. Both peptides (1mg/ml) were dissolved in buffer containing 20 mM glycine, 150 mM NaCl and 0.6M GuHCl, pH 2.0. Inset shows wavelength scans for both peptides recorded at 0°C, with the characteristic maximum at 225 nm. All samples were run under the same standard conditions (average heating rate = 0.1°C/min) 30.
(b) Temperature dependence of the excess partial molar heat capacity (heating rate = 1°C/min) for GF (solid line) and GFO (dotted line) peptides monitored by differential scanning calorimetry. The calorimetric enthalpy values shown in table 2 represent the integration of the peaks. Both peptides (1mg/ml) were dissolved in buffer containing 20 mM glycine, 150 mM NaCl and 0.6M GuHCl, pH 2.0.


