
Figure 4.
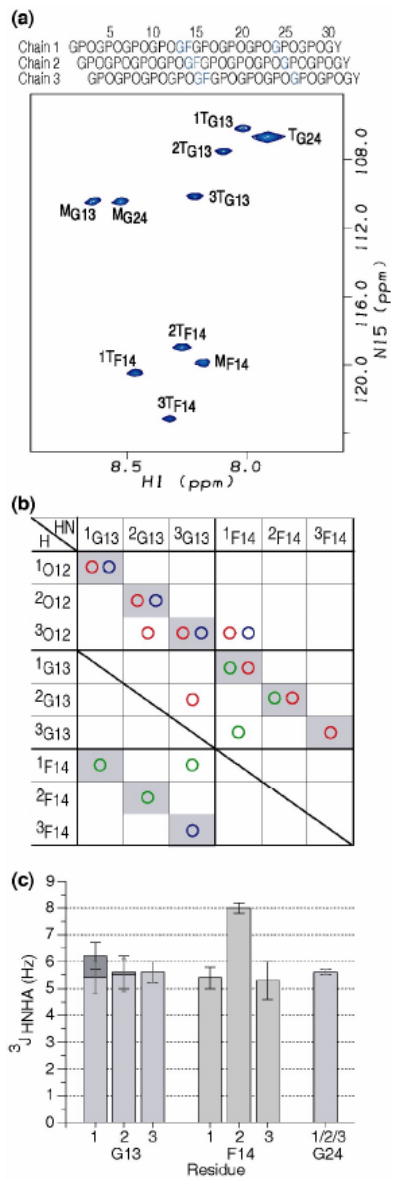
(a) 1H-15N HSQC spectrum of peptide GF at 10°C. Sequence diagram of the peptide above the HSQC shows the characteristic one residue stagger. The isotope-labeled residues are colored in blue. All labeled residues Gly13, Phe14 and Gly24 have trimer peaks as well as monomer peaks, showing the GF interruption is incorporated into a trimer. The peaks corresponding to the monomer and trimer state are denoted with a superscript M or T, respectively. Leading, middle, or trailing chain stagger assignment is indicated as chain 1, 2, or 3 by a number in front of the superscript T.
(b) Contact map generated from NH-H experimental NOEs from the NOESY-HSQC experiment for the GF peptide. Experimental NOEs for GF peptide are represented by circles (HN-HN( ), HN-Hα(
 ), and HN-side chain protons(
 )). Intrachain NOEs are shaded in gray. Interchain contacts are consistent with one residue staggering of triple helix.
(c) Experimental 3JHNHa coupling constants of peptide GF. 3JHNHa coupling constants for Gly13, Phe14 and Gly24, with the two Hα Gly residues shown as dark gray and light gray bars.