
Figure 6. Model structures of peptide GF.
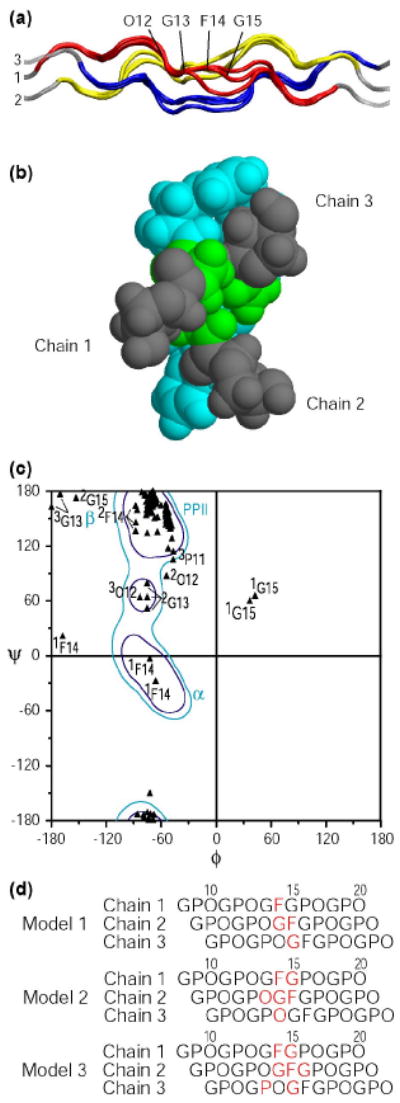
(a) Ribbon diagram of three GF models represented with the N-terminal at the left and chain numbers. The NMR parameters are used as restraints in the energy minimization, including the phi angle restraints from J coupling constants and distance restraints from NOEs. A set of three model structures that are consistent with all NMR experimental data were obtained. Leading, middle and trailing chains are represented as 1 (red), 2 (yellow) and 3 (blue), for the energy minimized segment of residues 6 to 19. The O12 to G15 residues in chain 1 of one structure are labeled for clarification.
(b) Space filling model of the cross section view from the N terminus to the C terminus of one model structure of GF. This view shows that at the GF region the G13 residues are closely packed at the center while the F14 residues are on the outside. The OGF segment is colored as O12( ), G13(
 ), and F14(
 ).
).
(c) Ramachandran plot for three possible model structures of GF. To highlight the central region of the peptides, only residues 6 to 19 in all 3 chains of GF are plotted and shown in black triangles. Residues which fall outside the polyproline II region are labeled with the residue number and the chain (superscript). Values for the three models are given, so the presence of three values of 1F14 indicates that the Phe in this leading chain is outside the PPII region in all three models. The Ramachandran contour map for Pro residues is shown in the background and typical secondary structures are indicated, where α denotes α-helix; β denotes the β-sheet region; and PPII denotes the polyproline II and collagen region.
(d) Diagram of the 3 staggered chains near the GF sequence, showing the residues in red which fall outside the PPII dihedral angle region on the Ramachandran plot for the 3 acceptable models.