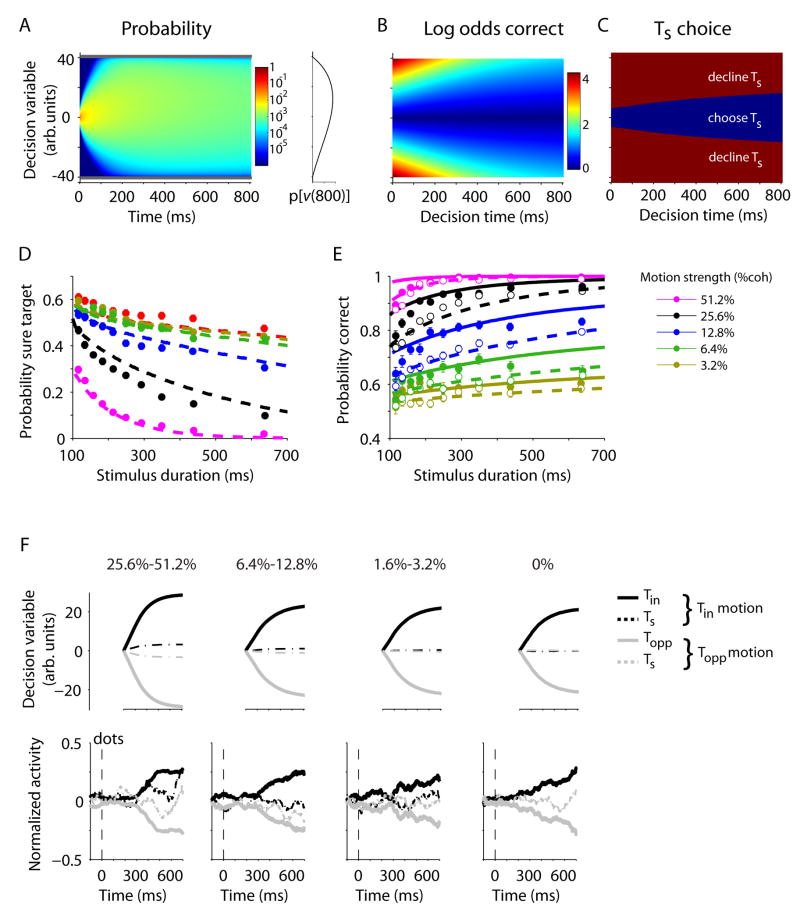
Figure 4.
A simple bounded evidence accumulation model predicted both the behavioral results and the modulation of LIP responses. (A–C) The model. On each trial, the accumulation, v(t), diffuses to one of the decision bounds (gray lines). The process terminates when v(t) reaches a bound or the stream of motion evidence ceases. (A) Representation of v(t) as a propagating probability density, for all motion strengths, when the rewarded direction is rightward. Positive values for v(t) represent accumulated evidence in favor of rightward. At time zero, the distribution is a delta function at v=0. As time elapses, the range of v(t) expands to fill the space between the two bounds, and there is a drift toward positive values, as shown by the probability density of v at t=800ms (inset to the right of color map). The distribution associated with leftward motion (not shown) is the mirror symmetric graph reflected about v=0. (B) The log odds of a correct response based on the value of v(t) at decision time. Correct responses are associated with larger v, but the relationship between v and probability correct changes with decision time. (C) Ts is chosen when the probability of a correct response is less than a criterion level. (D–E) Model fits and predictions. The three model parameters (Table S1) were fit to the observed frequency of correct responses on trials in which Ts was not shown and the observed frequency of Ts choices on trials in which Ts was shown. These parameters predict the probability of a correct response on trials in which Ts was waived (solid curves in E). (F) Comparison of model predictions and neural data. The average trajectory of v(t) in the model was calculated for different coherence levels using the fit parameters. The calculation is based on the stimulus durations used in the experiment, and assumes that v is fixed from termination of accumulation process. The calculated trajectories (top) resemble the LIP responses (bottom). Neural responses were detrended by subtracting the mean response at each moment and shifted by the neural latency (200 ms).

