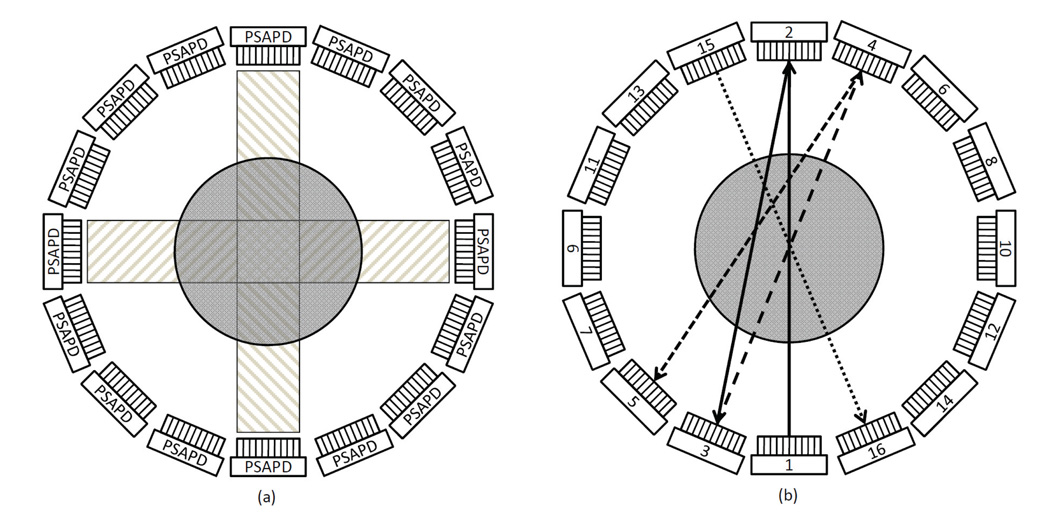
Figure 12.
Timing alignment scheme: to generate offset map for each individual PSAPD (a) and between PSAPDs (b). The cylinders in (a) and (b) represent the sources. The rectangles in (a) represent the regions covered by the opposing detector pairs. The lines with arrows in (b) show the calibration sequence, starting from PSAPD #1 and ending at #16. The lines from #5 to #15 are omitted for clarity.

