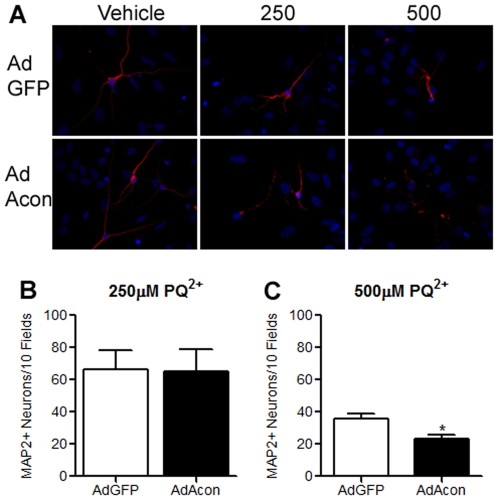
Figure 9. Overexpression of m-aconitase leads to neuronal loss.
(A) Representative images of neurons from AdGFP and AdAcon transduced cultures stained with MAP (red) after 18 hrs of 0, 250 and 500 µM PQ2+ incubation. Nuclei (blue) were counterstained with DAPI. Neurons with intact nuclei from AdGFP and AdAcon transduced cultures were counted after 18 hrs of 250 µM PQ2+ (B) and 500 µM PQ2+ (C), data are expressed as MAP2+ neurons/10 fields, * p<0.05, t-test (n = 6).

