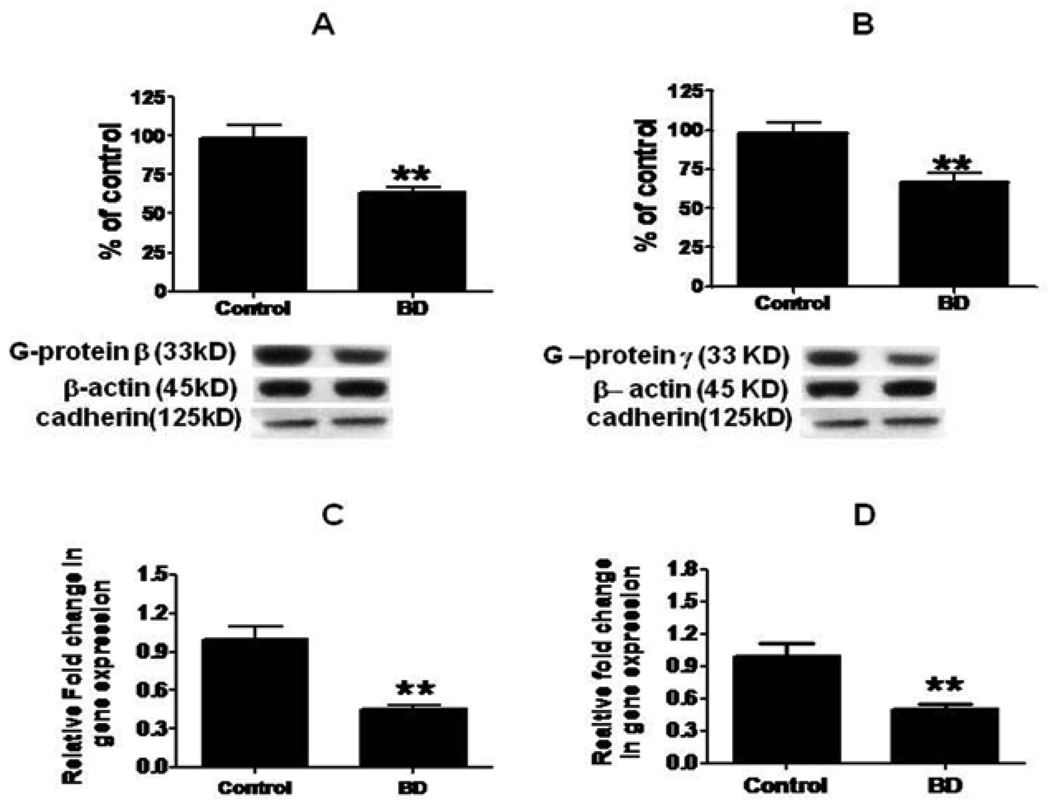
Figure 1.
Mean G-protein β (A), and G-protein γ (B) protein (with representative immunoblots) in control (n = 10) and BD frontal cortex (n = 10). Data are ratios of optical densities of G-protein subunits to β-actin, expressed as percent of control. mRNA levels of G-protein β (C) and G-protein γ (D) in postmortem control (n = 10) and BD (n = 10) frontal cortex, measured using real time RT-PCR. Data are levels of G-protein βγ subunits in the BD patients normalized to the endogenous control (β-globulin) and relative to control level (calibrator) using the ΔΔCT method. Mean ± SEM, **p < 0.01.

