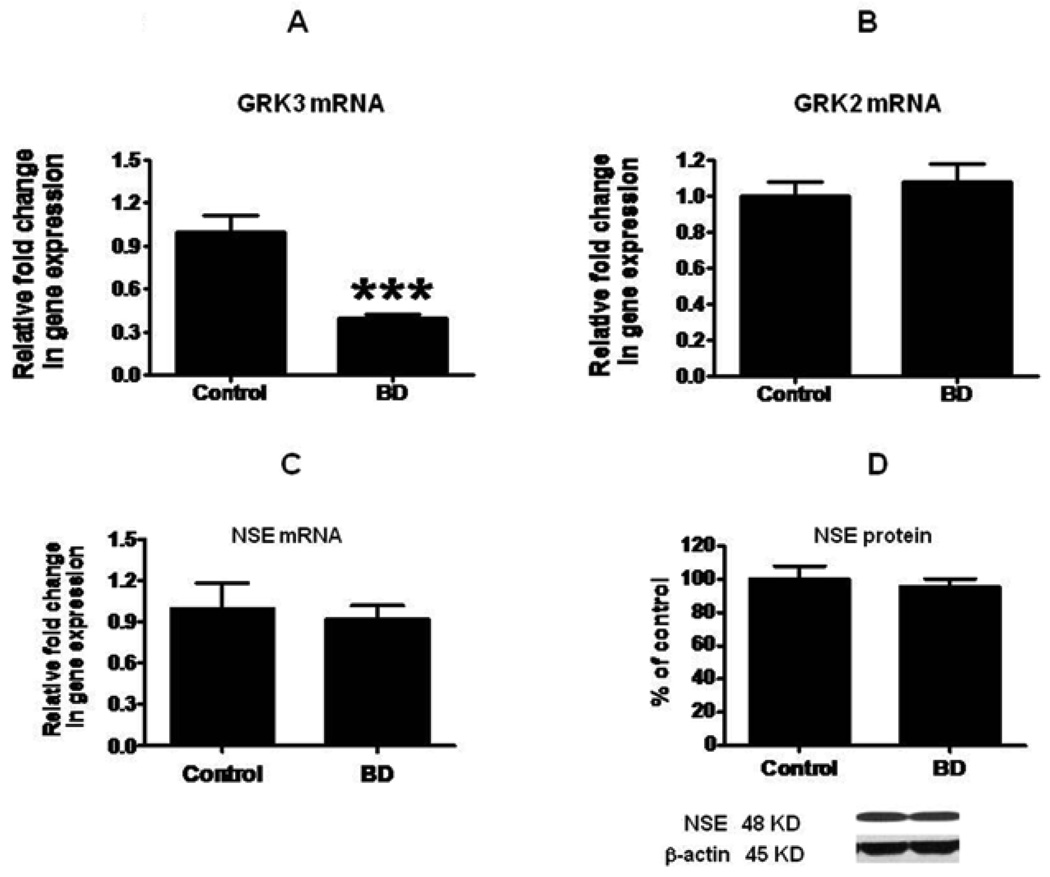
Figure 3.
mRNA levels of GRK3 (A), GRK2 (B) and NSE (C) in postmortem control (n = 10) and BD (n = 10) frontal cortex, measured using real time RT-PCR. Data are levels of GRKs and NSE in the BD patients normalized to the endogenous control (β-globulin) and relative to control level (calibrator), using the ΔΔCT method. Mean neuronal specific enolase (NSE) (D) protein in postmortem frontal cortex from control and BD subjects. Bar graph is ratio of optical density of NSE protein to that of β-actin, expressed as percent of control. Mean ± SEM, ***p < 0.001.

