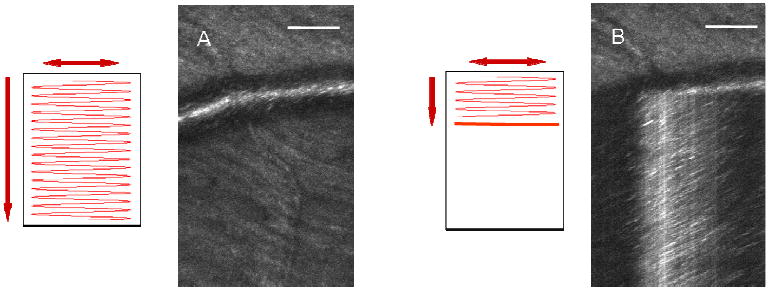
Fig. 2.

Schematic of two different scanning modes and the resulting images from the AOSLO: (A) regular scanning and the XY image, (B) top 1/3 with regular scanning and bottom 2/3 with XT scanning. The image is a hybrid image with top 1/3 being an XY image and bottom 2/3 being an XT image. Scale bars are 100 μm.
