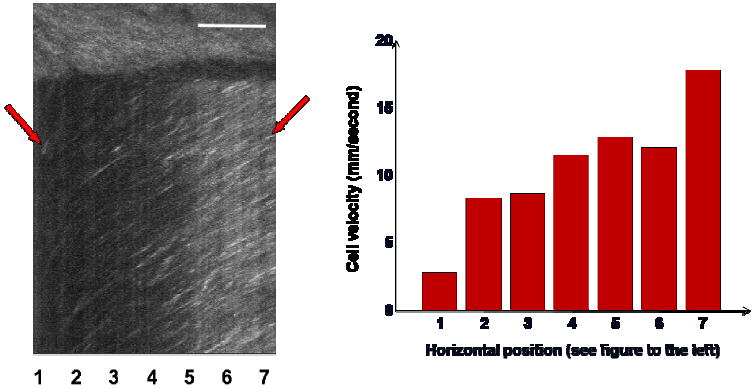
Fig. 6.

Change of erythrocyte velocity across the vessel lumen. The different slope angles in the XT image represent different velocities, with steeper slopes indicating lower velocities. At the left and right side of the XT image, the scan line is near the vessel wall and vessel axis, respectively. The horizontal position is noted with different numbers at the bottom of the XT image, and the corresponding velocity profile is shown in the bar plot. Scale bar is 100 μm.
