
Figure 7.
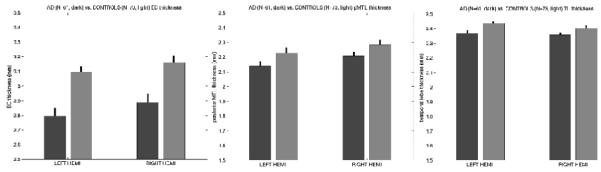
Comparison of AD and control mean cortical thickness in EC (left), posterior medial temporal lobe (center) and the entire temporal lobe excluding the predicted location of EC (right). The black bars represent the standard error of the mean in a random effects analysis across subjects.