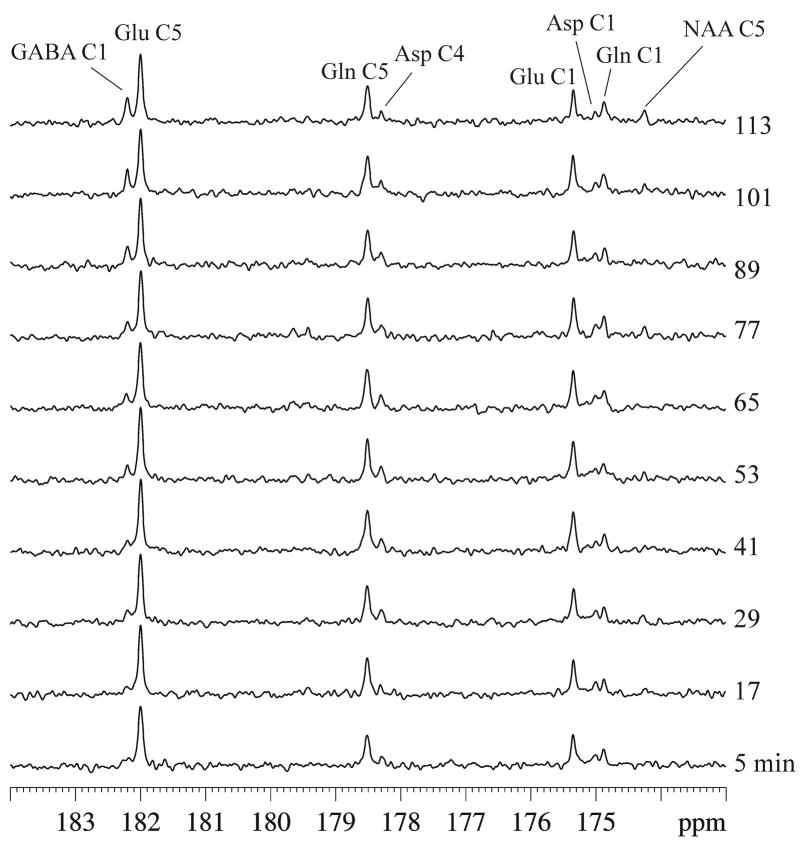
Fig. 2.
Typical in vivo 13C spectra of GABA-transaminase inhibition during continuous infusion of [2,5-13C2]glucose acquired from an approximately 8.5 × 6 × 8.5 mm3 voxel in an individual rat (gb = 0.06, lb = −1. NS = 30 per spectrum with a total experimental time of ~2 hrs). The following signals were detected: glutamate C5 at 180.2 ppm, glutamine C5 at 178.5 ppm, GABA C1 at 182.3 ppm, aspartate C4 at 178.3 ppm, glutamate C1 at 175.4 ppm, glutamine C1 at 174.9 ppm, aspartate C1 at 175.0 ppm, and N-acetylaspartate C5 at 174.3 ppm. Bicarbonate signal was detected at 161.0 ppm (not shown for clarity). Glu: glutamate, Gln: glutamine, Asp: aspartate, NAA: N-acetylaspartate.

