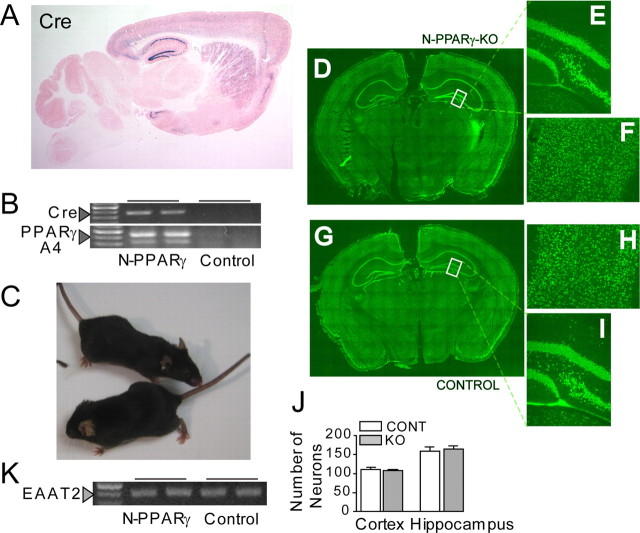
Figure 1.
A, Photograph of LacZ staining in the Tg-62–Cre mouse showing the Cre/LoxP recombination pattern. A sagittal section shows that the Cre/loxP recombination (indicated by blue X-gal signals) is restricted to the forebrain regions and primarily the cerebral cortex, striatum, and hippocampus. Eosin was used for counterstain. B, Detection of mutant PPARγ mRNA by RT-PCR analysis. Messenger RNAs for the Cre and PPARγ were isolated from cerebral cortex of N-PPARγ-KO and LoxP (Control) mice at 3 months of age. Arrowheads indicate presence of Cre products (top) and recombined 300 bp and 400 bp PPARγ PCR products (bottom) (see Materials and Methods for more details). Note that expression of Cre corresponds with the appearance of unique RT-PCR bands specific to the recombined fragments of PPARγ. C, Both the control (bottom of the picture) and N-PPARγ-KO mice have normal appearance. D, The NeuN immunofluorescence (green) demonstrates neuronal density and distribution in N-PPARγ-KO (D–F) and the control (G–I) mice. Coronal section through a whole brain (D, G), hilus of dentate gyrus (E, I), and cerebral cortex (F, H) of representative mice at 3 months of age are shown. J, Summary bar graph illustrating neuronal (NeuN-positive cells) count in the cerebral cortex and in denature gyrus of hippocampus of Lox-P (control; CONT) and N-PPARγ-KO (KO) mice. Each count covered a 300 × 300 μm area. Data are expressed as mean ± SEM (n = 6 fields counted in 3 animals). K, Expression of astroglia-specific PPARγ gene target, EAAT2, is not affected in cortex of N-PPARγ-KO, compared with control mice, confirming neuronal specificity of the knockout.

