
Fig. 4.
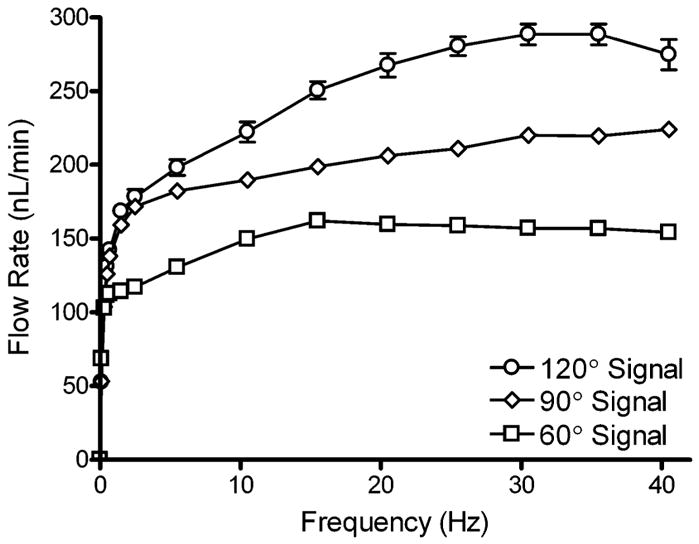
Effect of actuation frequency on flow rate generated by the micropump. Actuation signals with 120°, 90°, and 60° phases were compared. Flow rate was measured by tracking the linear velocity of a small bubble introduced into the capillary attached to the micropump outlet. Error bars are the standard error of the mean (n = 4).