
Fig. 6.
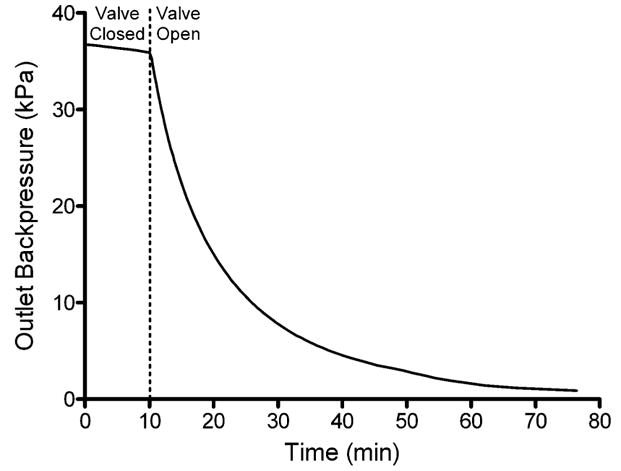
Micropump valve shutoff/leakage curve. The micropump was allowed to fully pressurize the outlet line connected to a pressure sensor. Actuation was then stopped in a position with a single valve in the fully closed position. Pressure measurements were monitored for ten minutes to monitor leakage through the closed valve. After ten minutes the closed valve was opened and further pressure measurements were obtained for the depressurization of the outlet line. The rate of pressure loss increased 41-fold when the valve was opened. The data shown here are from a single representative experiment.